Chart of the Day
Recent ROE Improvement Has Mainly Come from Higher Net Margin
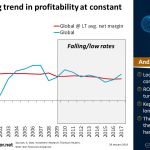
Chart of the Day: Looking at all non-financial companies and kept the net margin at the long-term average. The analysis shows us that the recent increase in ROE has come from the net margin.
Read MoreHigh Cash Conversion Cycle Means Companies Are Vulnerable
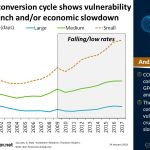
Chart of the Day: Looking at all non-financial companies globally, grouped by size. Cash conversion cycle (CCC) has risen for all companies following the GFC. The high CCC means that companies are more vulnerable to a credit crunch and/or economic slowdown.
Read MoreIn Asia, China Is Least Correlated to the US Market

Chart of the Day: We’ve looked at the correlation with the US market during the two major crises. China has been uncorrelated, a possible explanation is the Chinese regulation not allowing foreign access to its stock markets.
Read MoreDebt Burden Is Heaviest for the Gov’t in the US—but Not in China
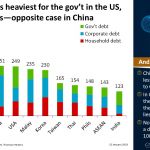
Chart of the Day: China and US have more or less the same level of debt to GDP. In China, corporates have the highest burden while in the US the heaviest burden lies on the government.
Read MorePeaking US Net Margin and the Hidden Effect of Fed’s Policy
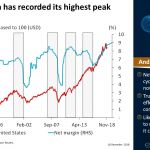
Chart of the Day: US net margin has recorded its highest peak since 1990. While net margin has been on the rise, efficiency has fallen. Fed’s policy of low interest rates has led to malinvestments, reducing efficiency.
Read MoreEV/EBITDA Has Only Been Higher in the US Before the Dot-Com Bubble Burst

Chart of the Day: The US market has traded in cheaper EV/EBITDA ranges 87% of the past 336 months. Historically, EV/EBITDA at this high level has led to negative subsequent returns on average.
Read MoreChina Has Been Twice as Hard to Predict

Chart of the Day: Globally, analysts have on average been 22% wrong in their EPS forecasts. Chinese analysts have been more inaccurate on average at 40%. Most accurate were Chinese analysts in Health Care.
Read MoreRevenue Growth of All Listed Non-Financial Companies in the World
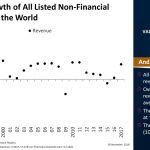
Chart of the Day: All business starts with revenue. We’ve looked at on average 12,621 non-financial companies. Over the past 23 years, revenue growth has averaged 6%.
Read MorePast Betas Tend to Regress Towards 1.0x
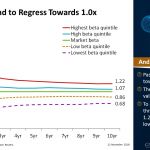
Chart of the Day: Past betas tend to regress towards 1.00x. The beta you use for valuation is to infinity. To avoid mistake we use three betas: High risk: 1.25x, Average risk: 1.00x, low risk: 0.75x.
Read MoreChange in Net Working Capital Is Small, but Volatile
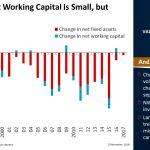
Chart of the Day: Changes in net working capital are volatile because that change results from five separate forecasts. Net working capital is a small but volatile investment item.
Read More