EV/EBITDA Has Only Been Higher in the US Before the Dot-Com Bubble Burst
What follows below are some charts looking at the EV/EBITDA and subsequent returns in the US market. Charts were presented on 18 December 2018 in our Global FVMR strategy.
EV/EBITDA has only been higher in the US before the dot-com bubble burst
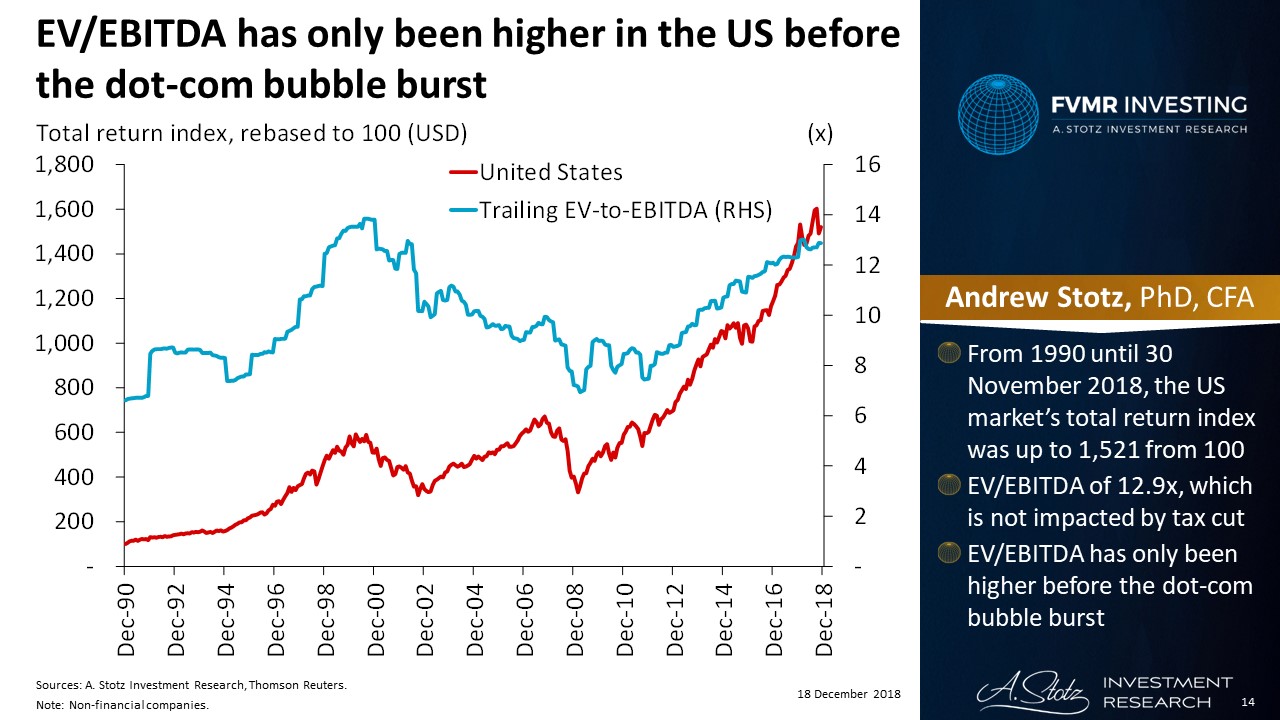
- From 1990 until 30 November 2018, the US market’s total return index was up to 1,521 from 100
- EV/EBITDA of 12.9x, which is not impacted by a tax cut
- EV/EBITDA has only been higher before the dot-com bubble burst
Low probability of positive subsequent returns at current EV/EBITDA range
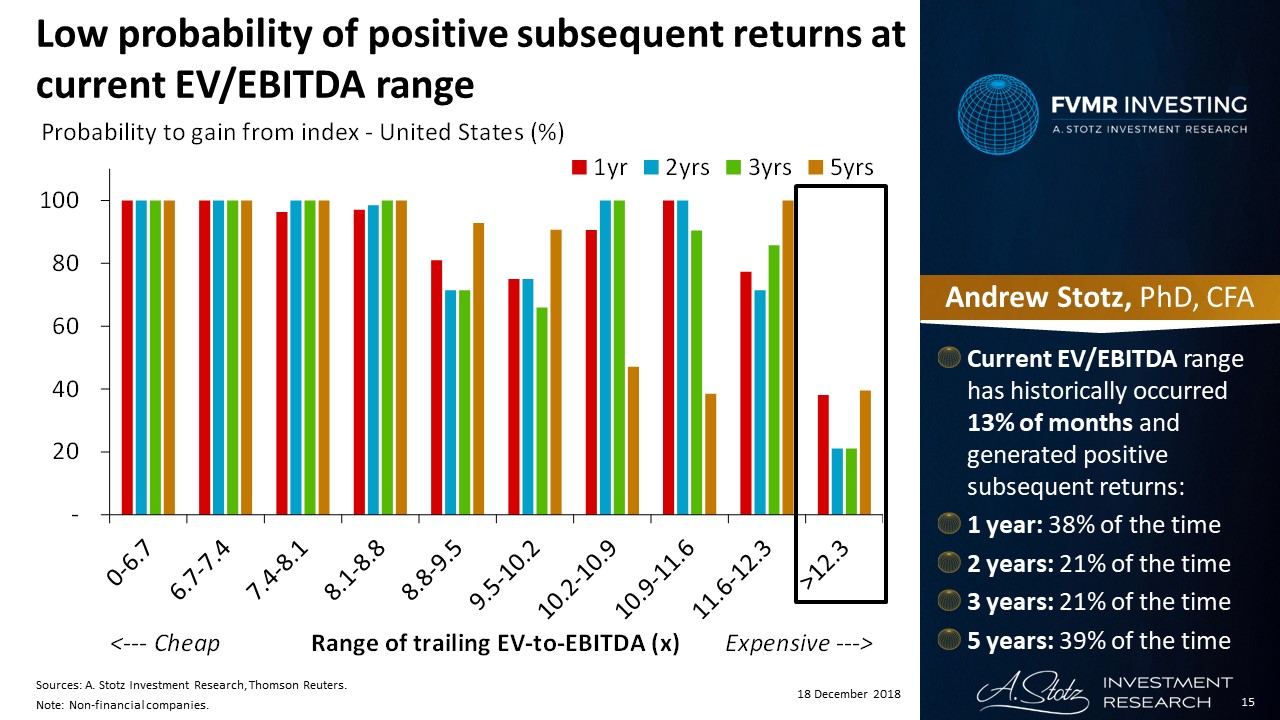
- Current EV/EBITDA range has historically occurred 13% of months and generated positive subsequent returns:
- 1 year: 38% of the time
- 2 years: 21% of the time
- 3 years: 21% of the time
- 5 years: 39% of the time
Historically, EV/EBITDA at this high level has led to negative subsequent returns on average
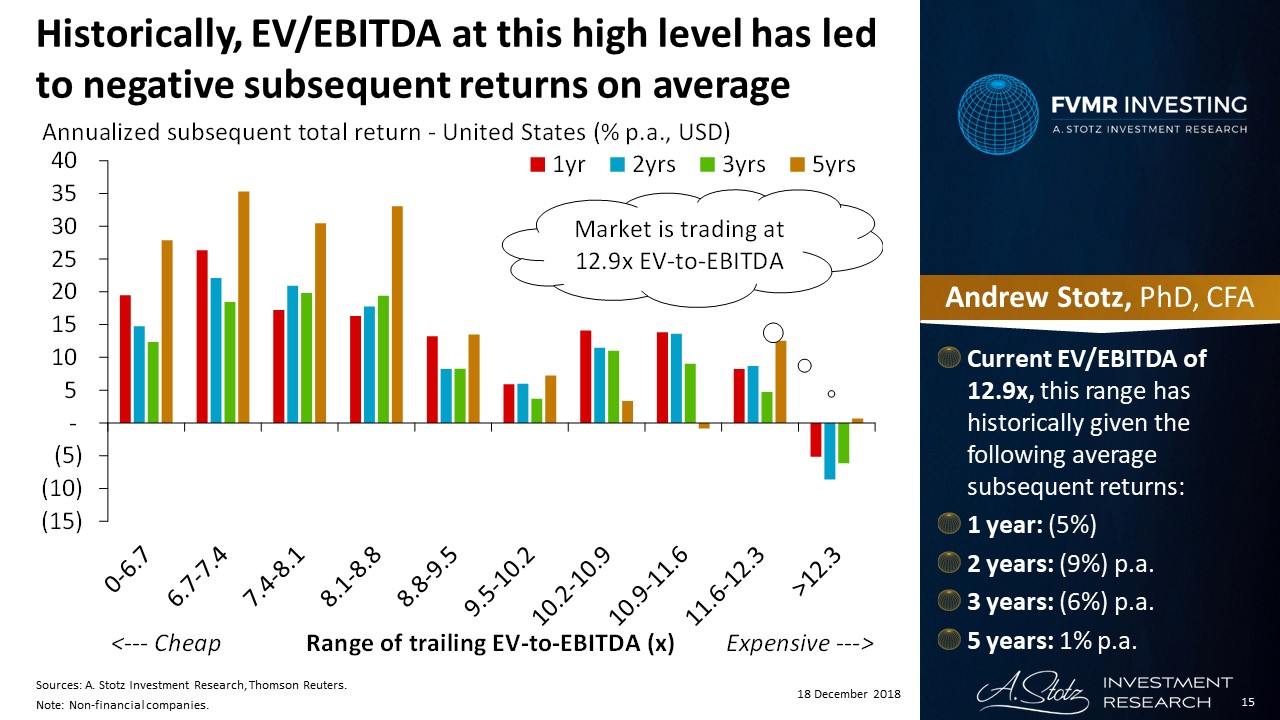
- Current EV/EBITDA of 12.9x, this range has historically given the following average subsequent returns:
- 1 year: (5%)
- 2 years: (9%) p.a.
- 3 years: (6%) p.a.
- 5 years: 1% p.a.
The US market has traded in cheaper EV/EBITDA ranges 87% of the past 336 months
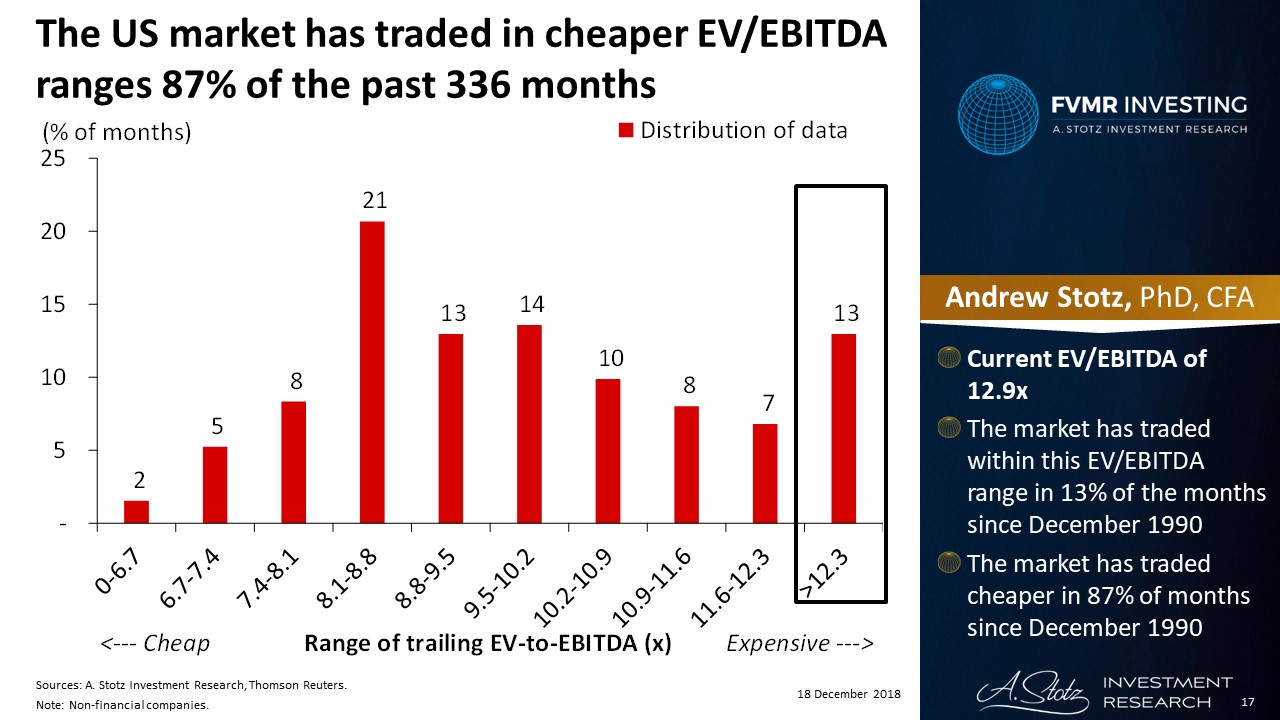
- Current EV/EBITDA of 12.9x
- The market has traded within this EV/EBITDA range in 13% of the months since December 1990
- The market has traded cheaper in 87% of months since December 1990
DISCLAIMER: This content is for information purposes only. It is not intended to be investment advice. Readers should not consider statements made by the author(s) as formal recommendations and should consult their financial advisor before making any investment decisions. While the information provided is believed to be accurate, it may include errors or inaccuracies. The author(s) cannot be held liable for any actions taken as a result of reading this article.