Korean Nuclear Power Monopolist is World Class
Watch the video with Andrew Stotz or read a summary of the World Class Benchmarking on Korea Electric Power.
Background
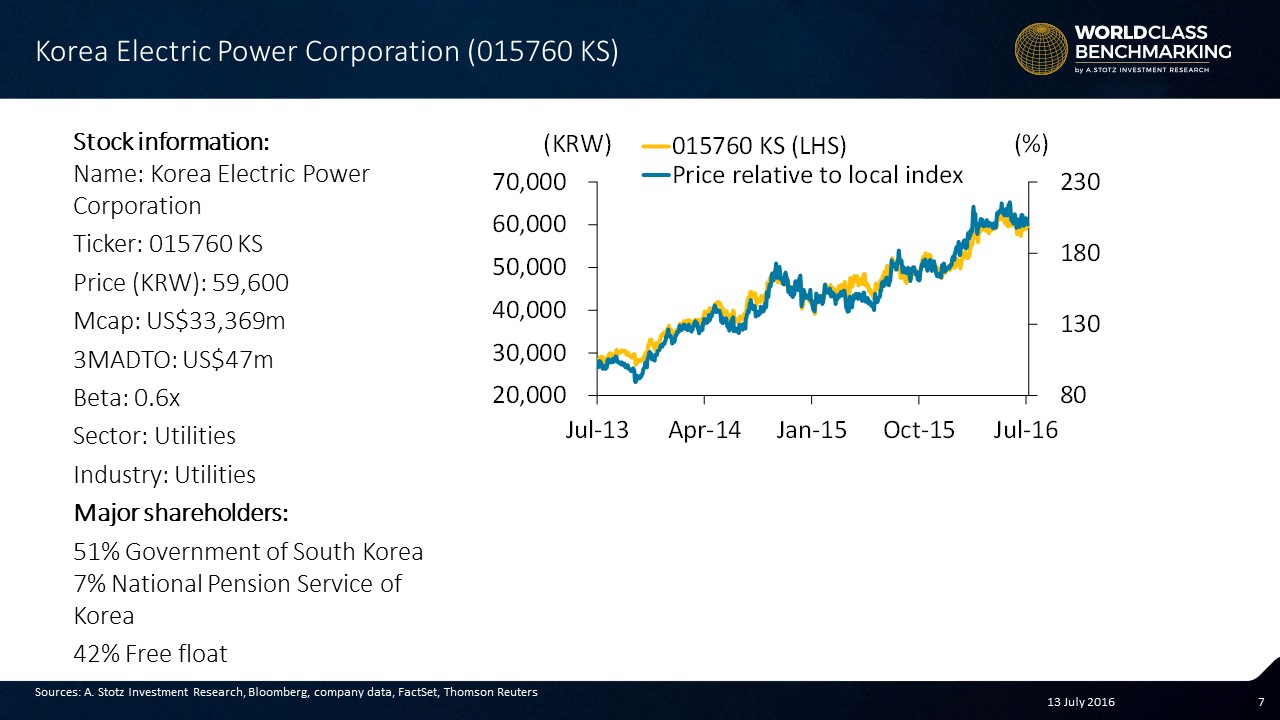
Korea Electric Power Corporation (Kepco) is the country’s largest electricity supplier and, via its subsidiaries, has a monopoly on nuclear power in South Korea. It has 32 projects in 17 countries, but 93% of the group’s revenue and profits are derived domestically.
The Korean government owns 51% and mandates pricing in line with underlying fuel costs.
Business Description
Kepco generates, transmits and distributes electric power via its five regional subsidiaries and additional nuclear power subsidiary. It enjoys a near monopoly on power production in South Korea.
In 2014 the company had a total installed capacity of 72,306 GW, and supplied 477,592 GWh, or more than 90% of Korea’s total electricity demand. It owns 84% of Korea’s power generation facilities.
The government mandates pricing following negotiations with Kepco. However, while fuel costs have fallen dramatically over the past year, the government and Kepco negotiate price movements with a time lag in mind.
The government prefers to avoid sharp price swings for consumers and industrial users. This allows Kepco to maintain capital expenditures for more efficient power generation facilities.
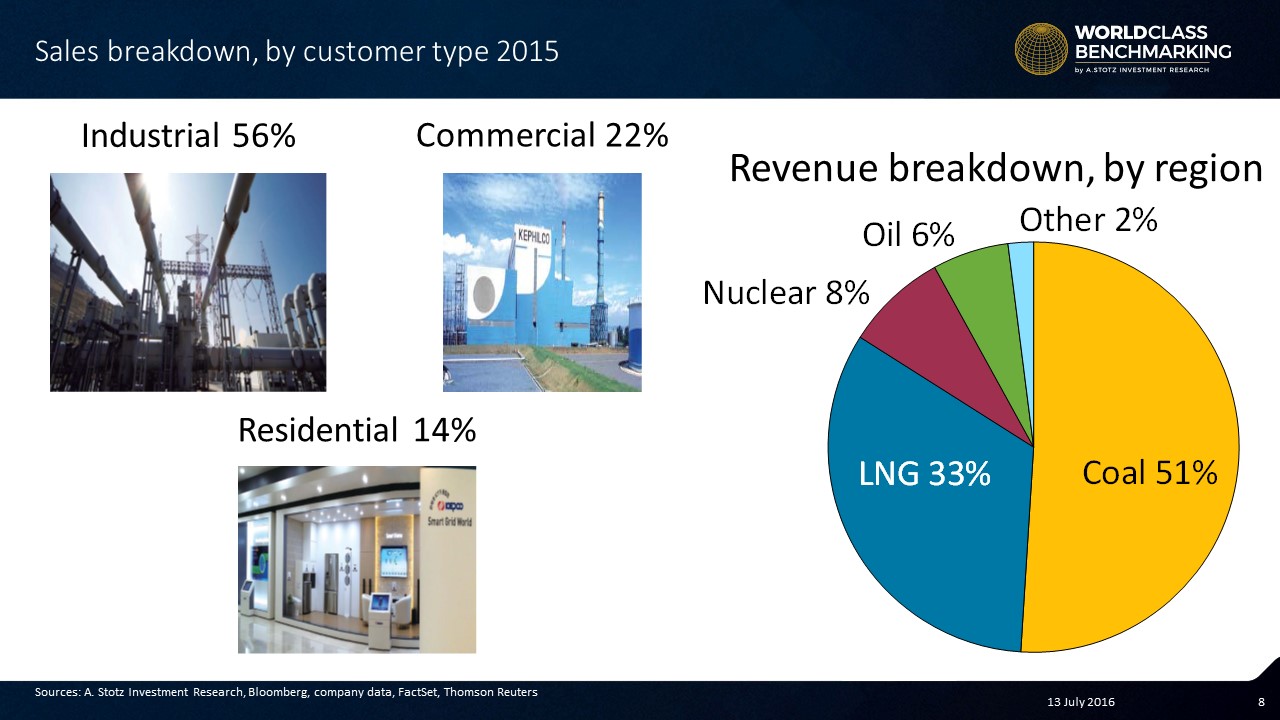
Kepco’s main fuel inputs are coal, liquid natural gas (LNG), oil, and nuclear power
World Class Benchmarking
Profitable Growth maintained its #1 rank. This means Kepco ranks better than 279 of 310 large utilities companies globally.
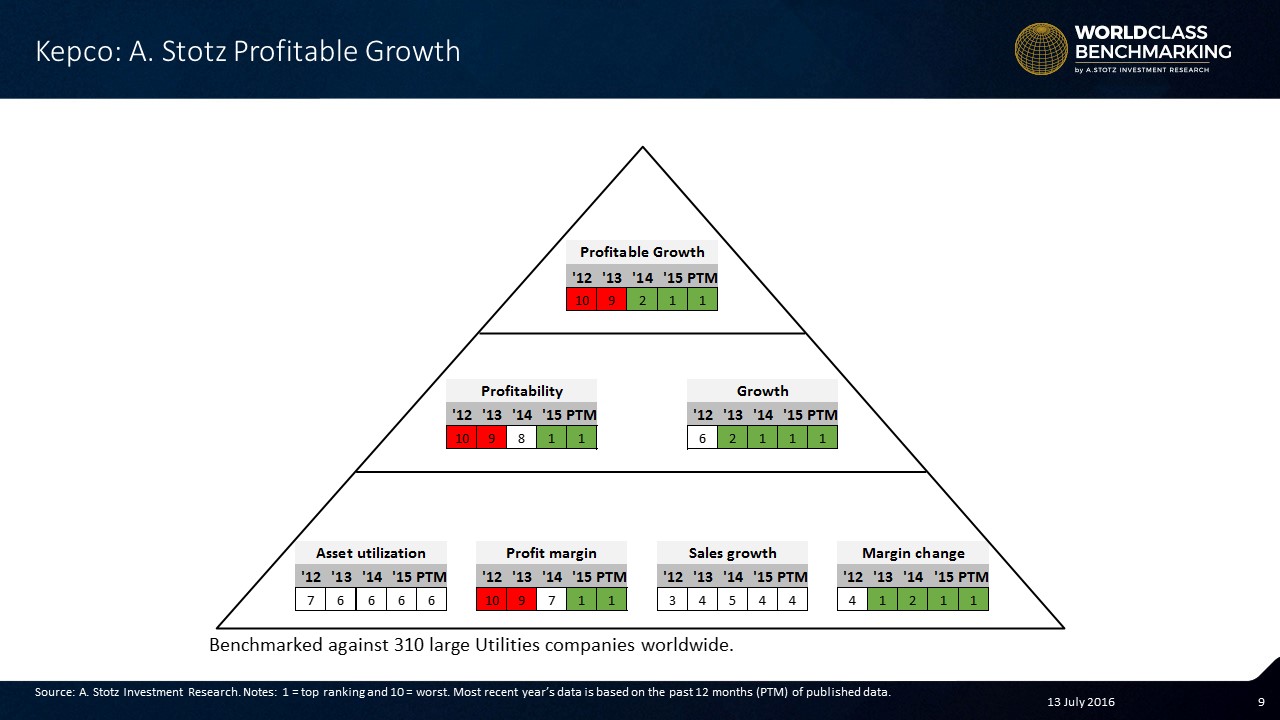
Profitability and Growth both maintained the #1 rank. This means Kepco ranks among the best 31 large utilities in the world on both measures.
Profit margin has been the driver of Kepco’s ROA. It’s gone from worst in 2012 to best. Margin change has also been a main driver of the improved Growth ranking.
Do YOU want to see the Profitable Growth rank for a company in YOUR portfolio?
Leave a comment below and we’ll post it if we have it.
DISCLAIMER: This content is for information purposes only. It is not intended to be investment advice. Readers should not consider statements made by the author(s) as formal recommendations and should consult their financial advisor before making any investment decisions. While the information provided is believed to be accurate, it may include errors or inaccuracies. The author(s) cannot be held liable for any actions taken as a result of reading this article.