Learning Valuation: China High Speed Transmission Equipment Group
Disclaimer:
This example was created on February 21, 2016. This is NOT a valuation, forecast, rating, or recommendation; rather, it is a teaching example. What follows is NOT investment advice; rather, it is a teaching example. It is intended only as academic information to those who want to learn about valuation. It should not be construed as the basis for any valuation or investment. The information in this presentation came from various sources which we believe are reliable, though we do not guarantee the accuracy, adequacy or completeness of such information. We hope you enjoy learning about valuation as much as we do!
Background
China High Speed Transmission Group Company Limited has the top market share of transmission gears used in wind power projects built in China.
- CHST is the biggest manufacturer in China by revenue of transmission gears for wind power equipment and has around half of the domestic market
- CHST also has a quarter of the market overseas for these products, the main customer in the US being GE
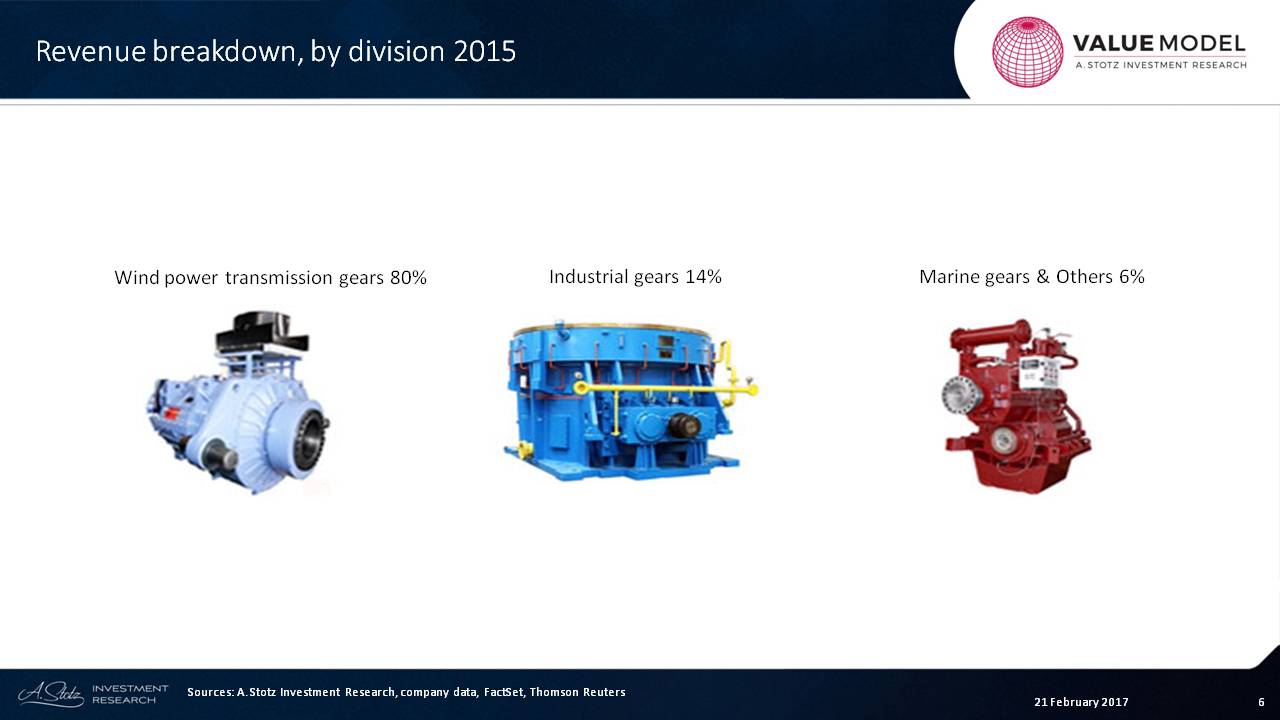
China High Speed’s revenue breakdown as of 2015 is as follows: 80% wind power transmission gears; 14% industrial gears; 6% marine gears and others.
Forecast
First of all, the main assumption is revenue growth. The company experienced revenue growth of 5% in 2016, but it has been as high as 25% in the past.
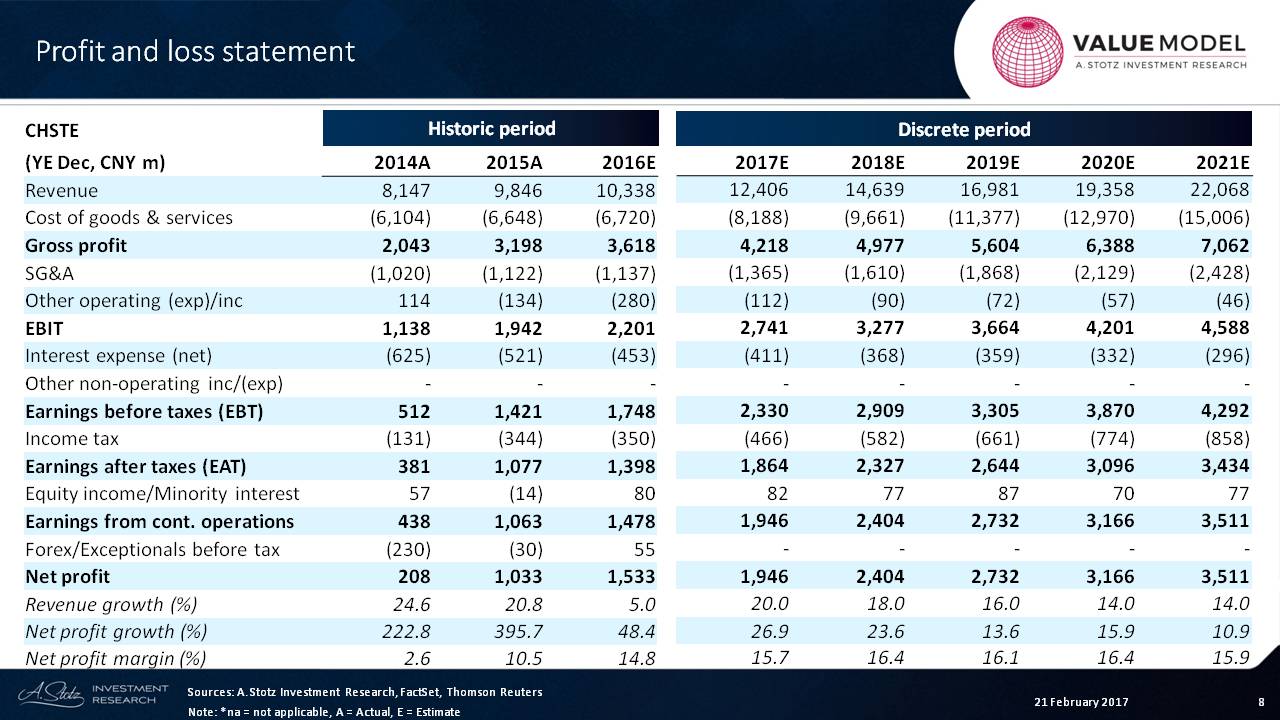
In this case, we can see our revenue assumption is going down to 14%. That’s going to be somewhat equal to EPS growth and net profit growth. You can see that the net margin has actually recovered quite substantially, and I’m going to predict that that’s going to maintain going forward.
Assets
First of all, what I like to look at is the amount of cash, and this company has been accumulating a lot of cash. Eventually, it will probably go down.
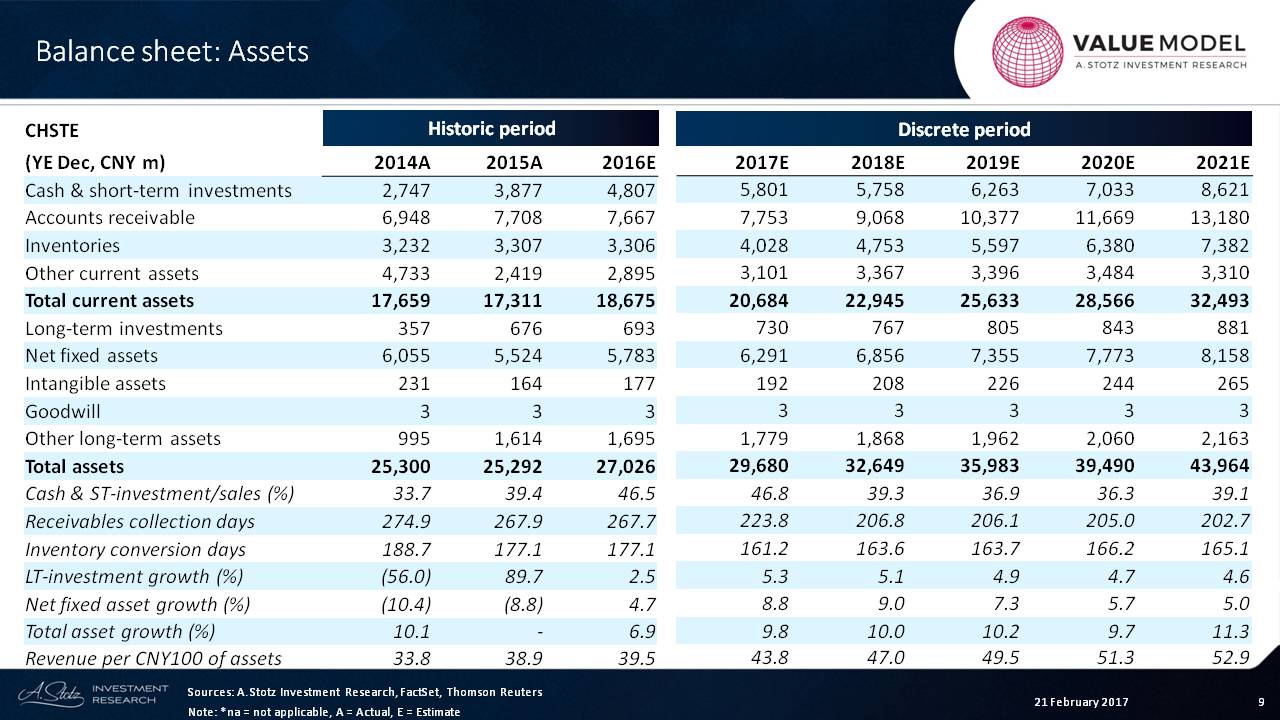
What we can see is the net fixed asset growth comes down as revenue starts to fall slightly.
What we can also see is an important measure ─ asset turnover ─ which has been improving steadily. And I expect it will improve over time.
Clearly, the company’s revenue growth will be higher than its assets growth in this forecast.
Liabilities and Equity
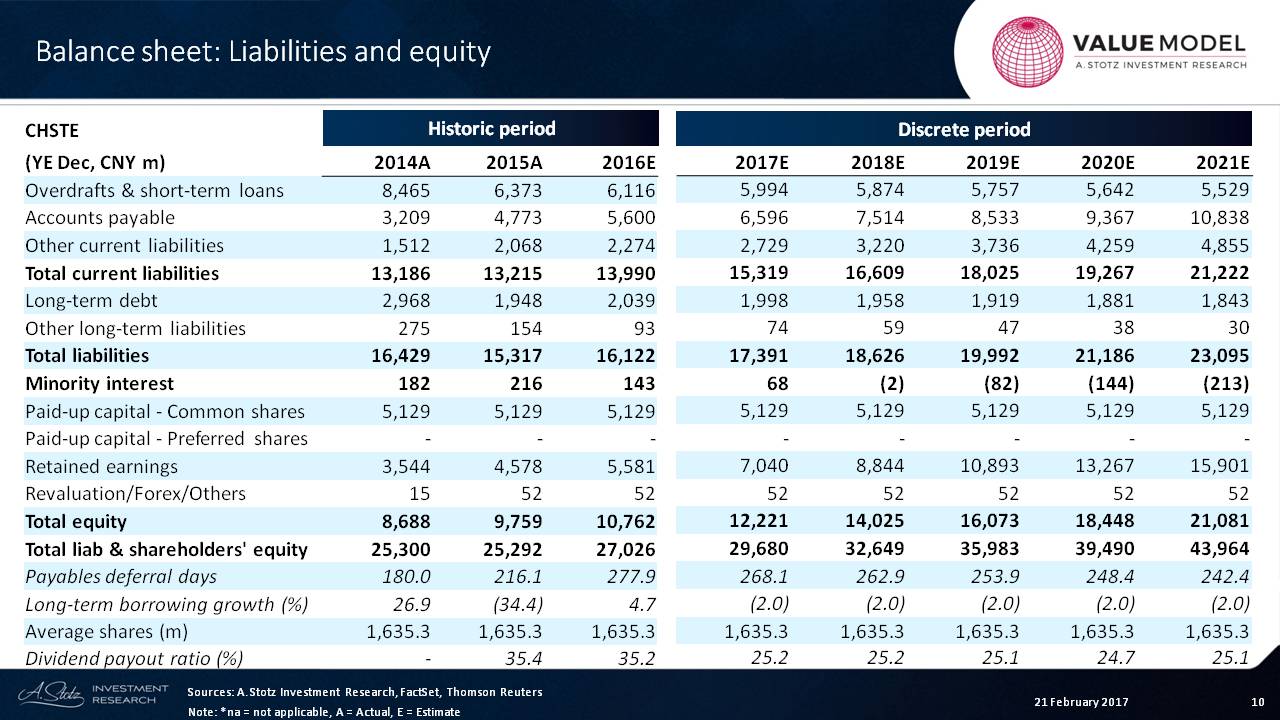
Now, let’s look at the liability side of the balance sheet, and the key item that we can see here is that accounts payable will finance a lot of this company’s current assets and even long-term assets. In fact, you can see that long-term debt is almost non-existent.
Where the rest of the financing will come over time will be through retained earnings. So as the company continues to make a high profit and retain most of it, they will be able to finance that growth.
And what we can see right here is that it’s a 25% dividend payout ratio that we’re expecting. That is why we can finance growth with retained earnings, and that means that 75% of earnings are going to be kept in the business.
Cash Flow
What cash flow does that give us?

Right here, we can see the operating cash flow growing over time. We can also see another very important input. To me, the most important inputs are what’s happening with working capital and what’s happening with CAPEX.
We can see steady growth in the amount of investment. If it’s a negative, it clearly means that the company does have more investment to do to get the growth that they want to have or the growth that I’m forecasting.
Free Cash Flow
Now, let’s move into the valuation section.
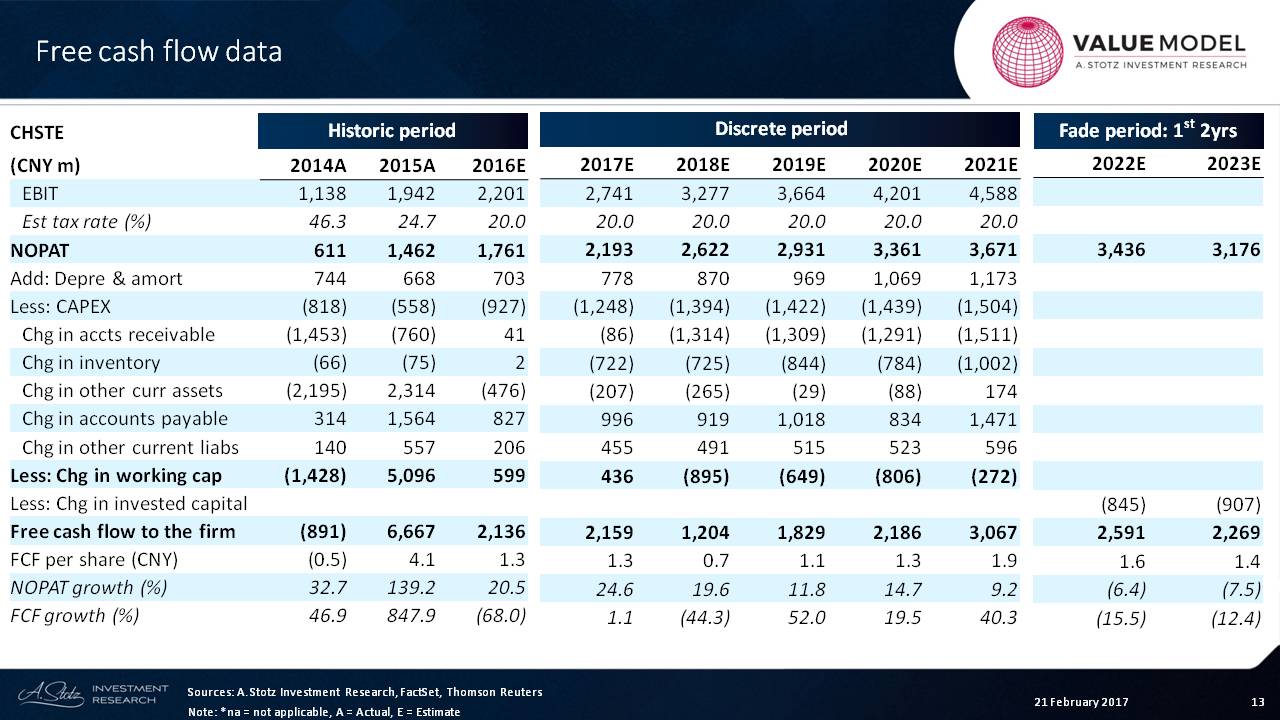
The first thing I want to look at is the free cash flow that we can derive from all of those forecasts.
First, we start with the earnings before interest and taxes, and we make an adjustment for the tax rate. It has been high in the past, but we’re going to assume it’s about 20%.
And we see the net operating profit after tax. What you’ll notice is that I have the historic date, then I have my discrete period, and then I look at the first two periods of the fade period.
Now, I had set that fade period within the model at 3 or 5 or 10 years, and this allows me to see the transition from discrete to fade.
What I’m looking at in particular is what’s happening with the free cash flow to the firm. We can see that it’s rising, but then it starts to fall slightly over time as we’re fading down the profitability of the company.
Invested Capital
Here we can see the structure of the liabilities. We have total debt and equity, and then there’s cash, which we back out.
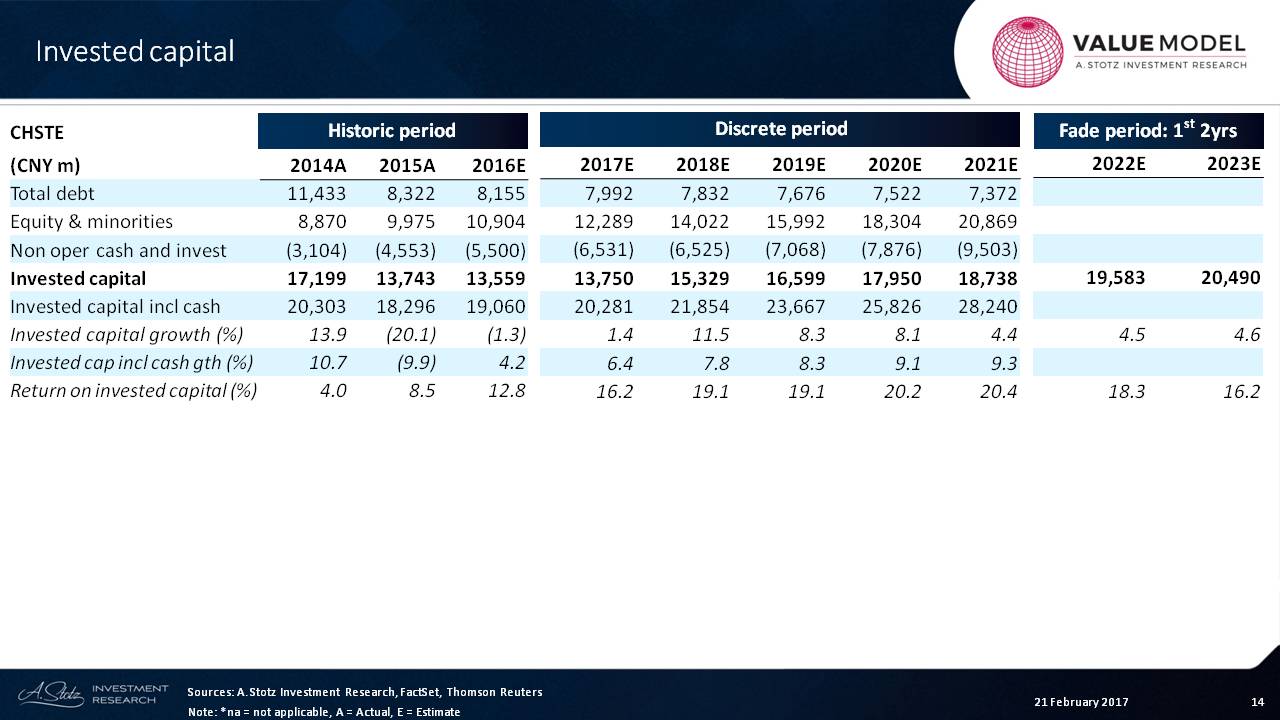
We can say that the amount of capital that’s been invested in this company is about 13 billion Chinese yuan, and that’s going to rise over time to as high as 18. Then this will taper off, and we’ll see the pretty slow growth at this point in the fade period.
The return on invested capital is the critical measure here, and we can see that it’s gone up to 12%, and it will be high over time.
Someone may say, “Oh, you’re too aggressive. Don’t be so aggressive in your return on invested capital assumptions here.”
That’s fine. We can do scenarios on that or we can say, “Let’s reduce that.”
The benefit of the fade period is that it allows us to make an adjustment on the return on invested capital.
And what should return on invested capital be?
It’s probably close to the industry average or to the cost of capital, and we’ll talk about that in a second.
Per Share Data
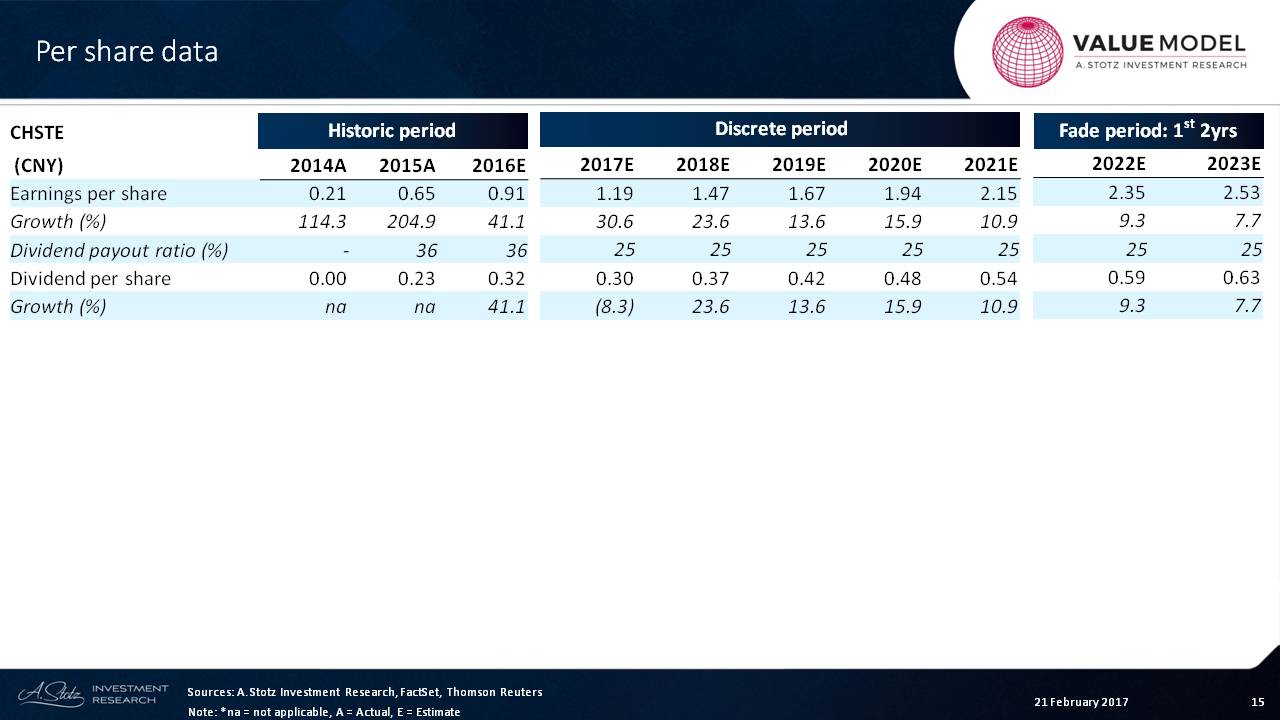
Now, let’s take a look at earnings per share.
We can see that the earnings per share growth has been darn high. It’s still high coming down, and then it’s stabilizing. And then you can see that growth slowing down.
What we can also see is that there’s no change in our assumption right now for dividend payout ratio during this period. So we’re going to see that the dividend growth is going to be the same as the growth in EPS.
Cost of Capital
What we can see from this is that we have to make a decision on the risk-free rate and the market premium.
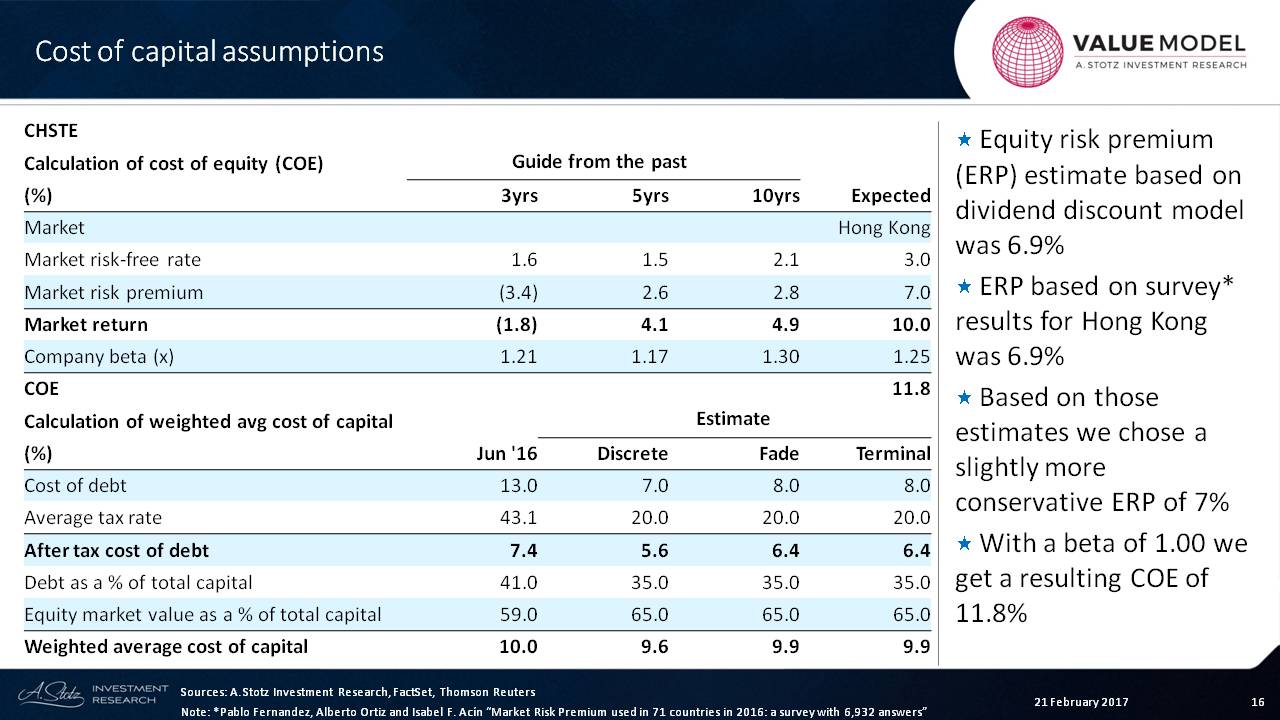
In this case, I’m going to use 3% for the risk-free rate for Hong Kong and 7% for the market premium ─ meaning, from now to infinity, the expectation is that the Hong Kong market will grow, on average, at 10% each year.
We can see that the company’s beta in the past has been a slightly higher risk than average, so I’m going to use a 1.25 beta, which gives me about a 12% cost of equity for the company.
We can look at the cost of debt and see that it was recently very high, but that will probably come down.
I’m also assuming that the tax rate is about 20% for the future periods. We can also see that debt has been a big component of the capital structure. I’m going to bring that down a little bit to 35%.
And so, from that, we can see a weighted average cost of capital over time of 9.6% for the discrete period and 9.9% for the fade and terminal periods.
Terminal Factors
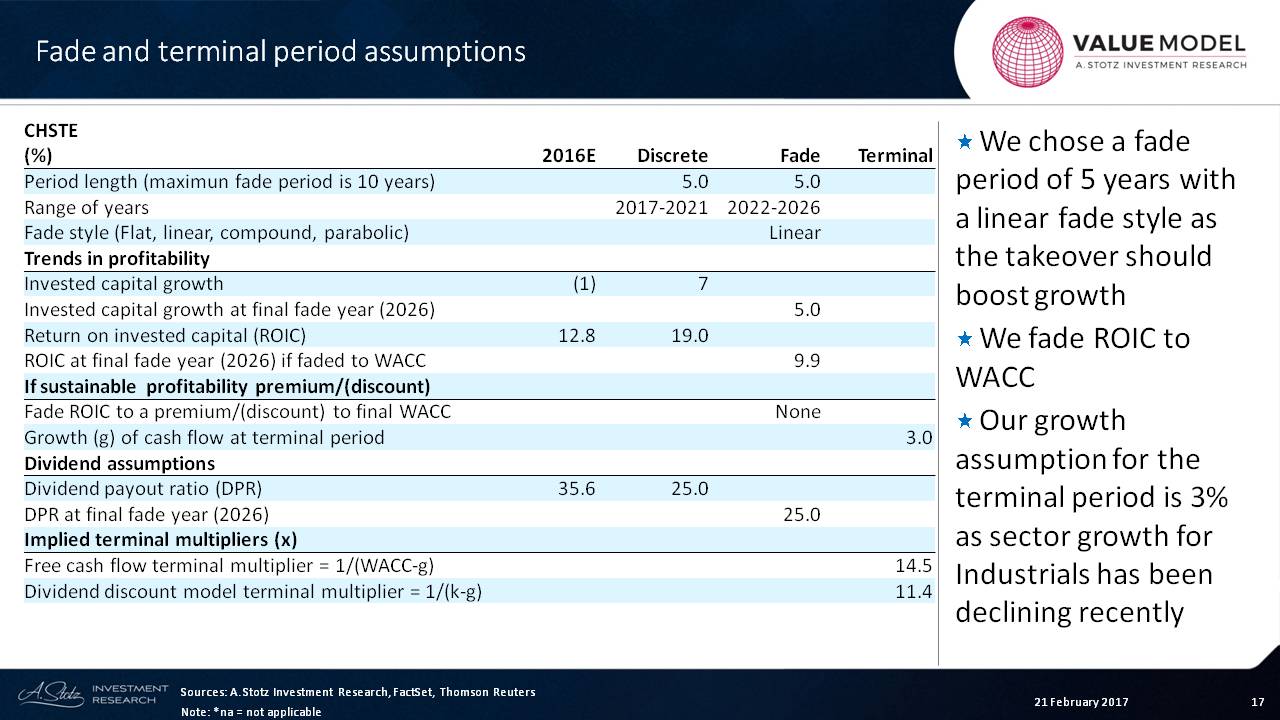
Next, we have to make some assumptions about the fade period. It’s a five-year discrete period. I always use five years for forecasting. And then, in this case, I’ll choose a five-year fade period and a linear fall in the profitability.
What we can see from this is that the invested capital growth at the final fade year is going to be 5%. This is just a check to make sure that I’m not crazy in my assumptions.
Also, the ROIC or the Return on Invested Capital of the final fade year ─ if it’s faded to the weighted average cost of capital ─ is the weighted average cost of capital of 9.9%. That means that we’re fading the ROIC to WACC, not to a premium or discount to WACC.
The growth in the terminal period, I’m assuming, is about 3%. In the fade period, we’ve got a dividend payout ratio of 25%.
We probably could increase that to 40% or even 50%, since over the long term, a company will pay out a high dividend. But for right now, let’s keep it there.
What are the implied multiples that come out of the assumptions related to the weighted average cost of capital, the growth assumptions, the cost of equity and the growth assumptions for the dividend discount model?
It tends to be that a high multiple here will increase the value of the terminal value, so we want to be careful. If this is a 20x multiple, it’s probably too high and something is wrong. If this is a very low multiple, then something is also wrong.
I would say that this is only slightly high, so I wouldn’t worry about that one too much.
NOPAT
We can see that we’ve got an actual period, which is yellow, and we can see that the NOPAT has been rising. And our discrete period is going to show a steady rise as well.
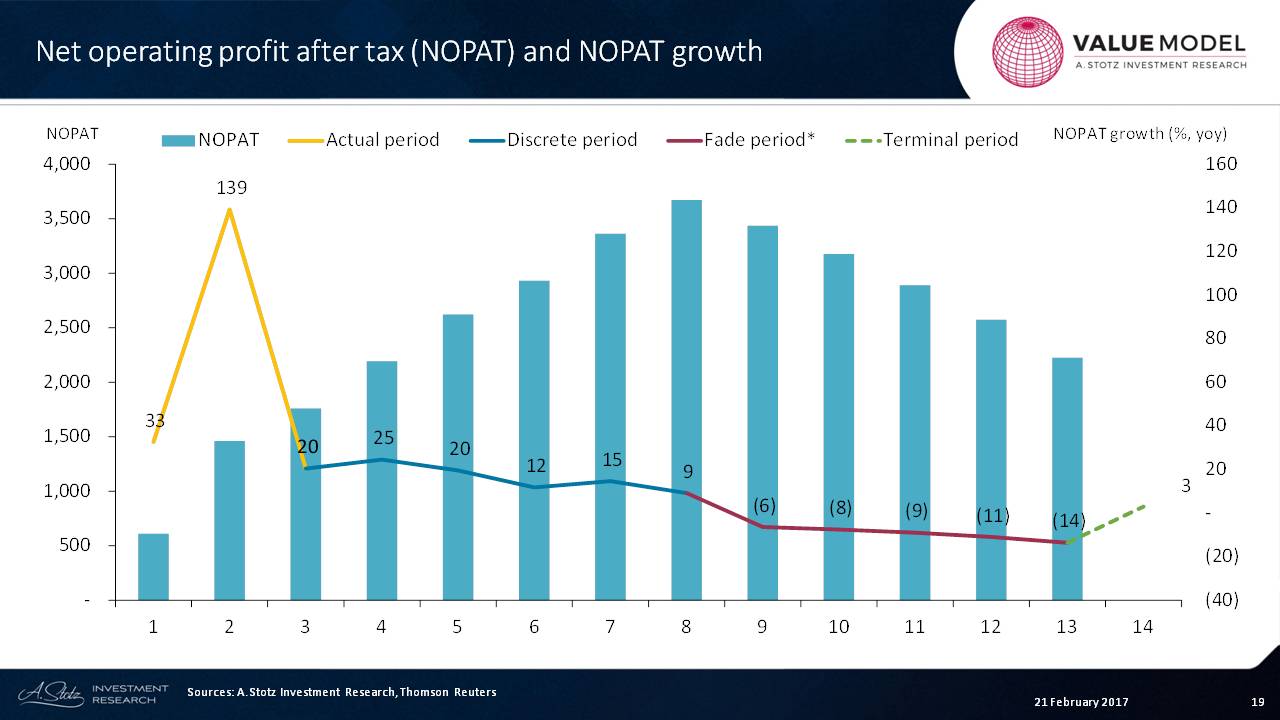
I don’t spend a lot of time trying to figure out a cyclical movement. And even if I could get that right, then I would only need an average to represent that.
After that, we move to a period of fade where we’re fading down the net operating profit after tax. And you can see that by the growth in net operating profit after tax, which is negative.
Eventually, we get to the terminal value.
Absolute Valuation
Now, if we look at the absolute value or the free cash value for the firm, we’re going to look at dividend, free cash flow to the firm, and free cash flow to equity. What we can see from this is that 50% of the value is in the terminal value here: 40% here and 26% there.
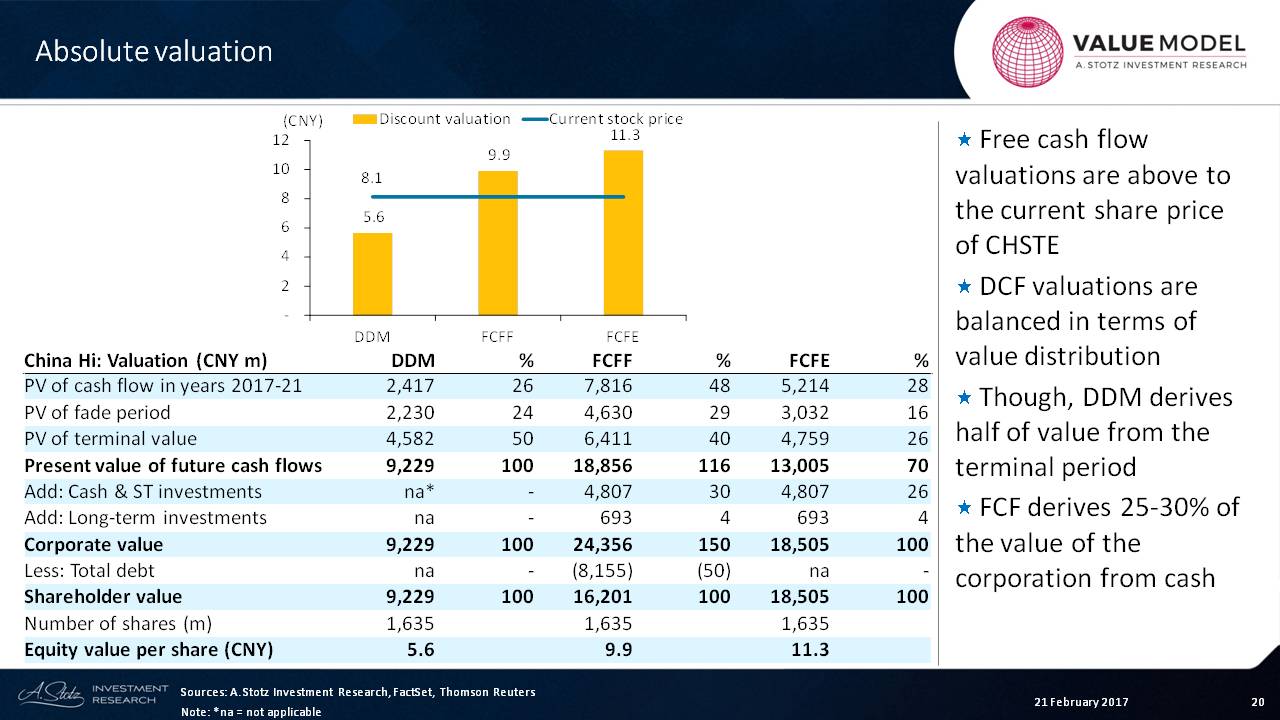
We can also see that when we look at free cash flow to the firm, we always add back cash that’s on the balance sheet, because this valuation section right here is related to what I call “operating value.” Free cash flow is related to the operating assets of the business, whereas this is just current value or, in other words, cash.
So we add back that current cash in both cases, and it can account for 25% to 30% of the value of the company.
In the case of free-cash-flow-to-equity, we take away what we have to pay in debt. What remains is this 16,201. Remember that we’ve used a WACC to discount this, and we’ve used a cost of equity to discount this.
What we can see from this is a range of values ─ 5.6; 9.9; and 11.3 ─ which shows that, generally, two of them are above.
Dividend discount models tend to understate the value, at least in Asia these days. So I would say that the value here is possibly above the price, which would mean that the company may look attractive based upon these assumptions.
Remember my assumption in the net profit margin? The growth in the future years, particularly in the discrete period, is very high. Remember, at the beginning, I said that we may adjust down that net profit margin.
Relative Valuation
The next thing is just to review PE.
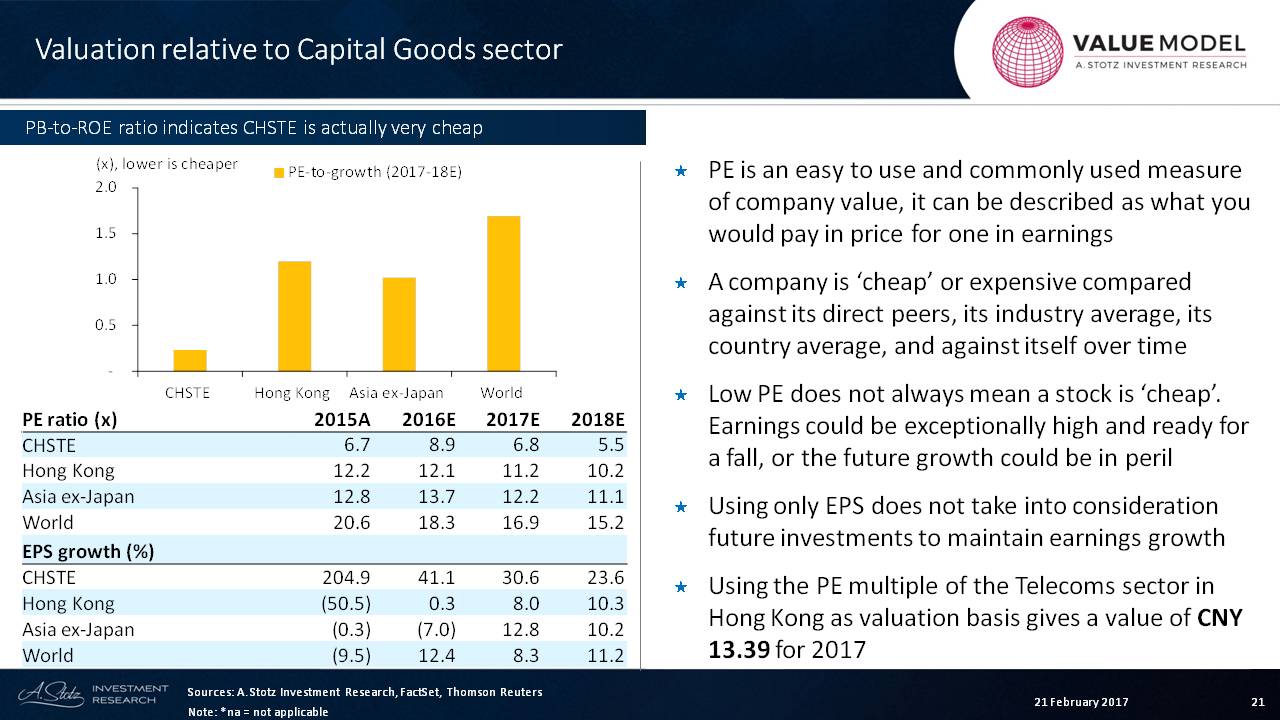
The PE is an easy-to-use and a commonly used measure of company value. It can be described as what you would pay in price for one in earnings.
A company is “cheap” or expensive compared against its direct peers, its industry average, its country average, and against itself over time.
I’m looking at this company in the capital goods sector. I’m looking at the Hong Kong capital goods sector, the Asian capital goods sector and the world.
I’m trying to compare against an industry average and a country average. So now we look at the forward periods.
We can go back a lot longer than that, but with Chinese companies, I think you’d get a distorted picture if you go back too far, because growth has been exceptionally high.
A low PE does not always mean that a stock is cheap. Earnings could be exceptionally high and ready for a fall, or the future growth could be in peril.
This company definitely is cheap relative to the industry average, if we want to look at it that way.
Using only EPS does not take into consideration future investments to maintain earnings growth. And it also doesn’t take into consideration perceptions of management or risk of corporate governance.
But using the PE multiple of the capital goods sector in Hong Kong as a valuation basis gives a value of about CNY 13.4 for the company based upon PE.
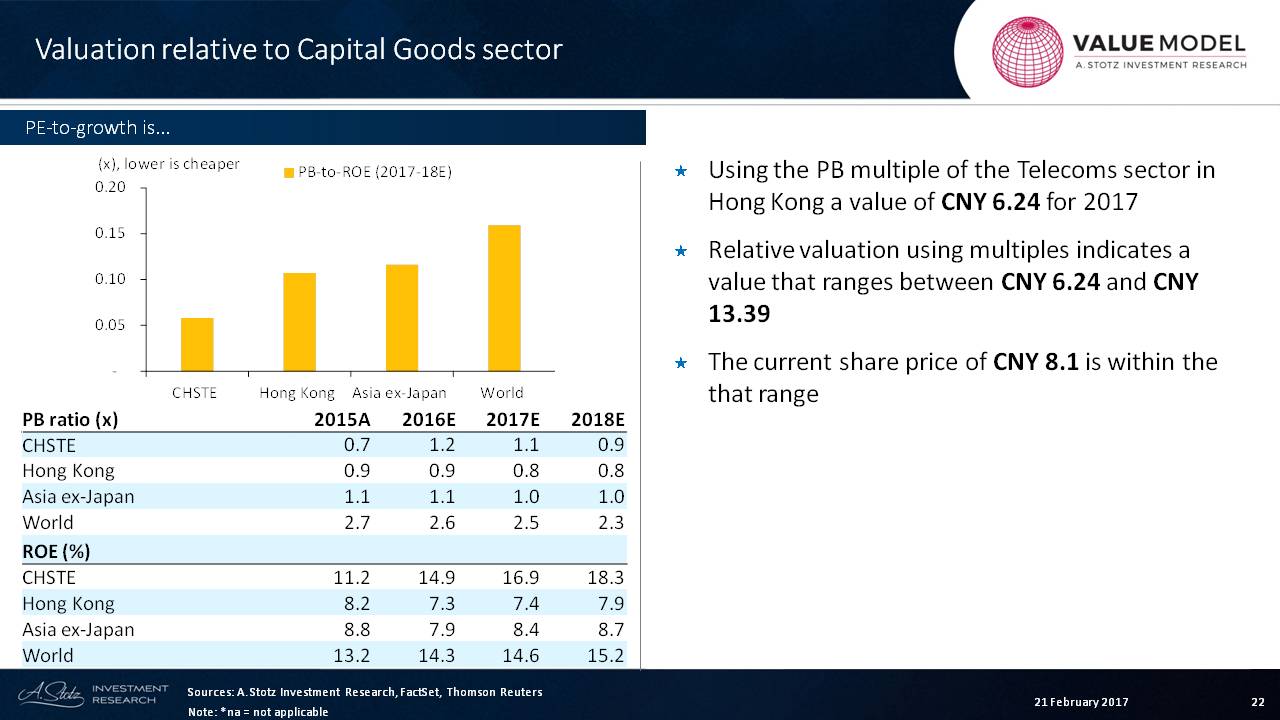
If we look at price-to-book for the capital goods sector, we can see that the company’s price-to-book is actually a little bit higher than the Hong Kong average and just about in line with Asia, but it’s much cheaper than the world.
So when you look at the world, just because the world is high in PE or price-to-book doesn’t mean that a particular country’s stock will converge on that point.
What we can see is that the company’s ROE is double what’s being earned across Asia, and it’s still at a premium to the world. Having a premium price-to-book probably makes sense. It could potentially even move higher but there must be other factors.
Again, using the price-to-book multiple of the capital goods sector, we can come up with a value of about CNY 6.24.
Relative valuations using multiples indicates a value that ranges between CNY 6.24 and what we saw in the past page – CNY 13.4. The current share price of CNY 8.1 is within that range.
So is the company super cheap?
Probably not.
Is it super expensive?
No. It doesn’t appear to be.
Sensitivity Analysis
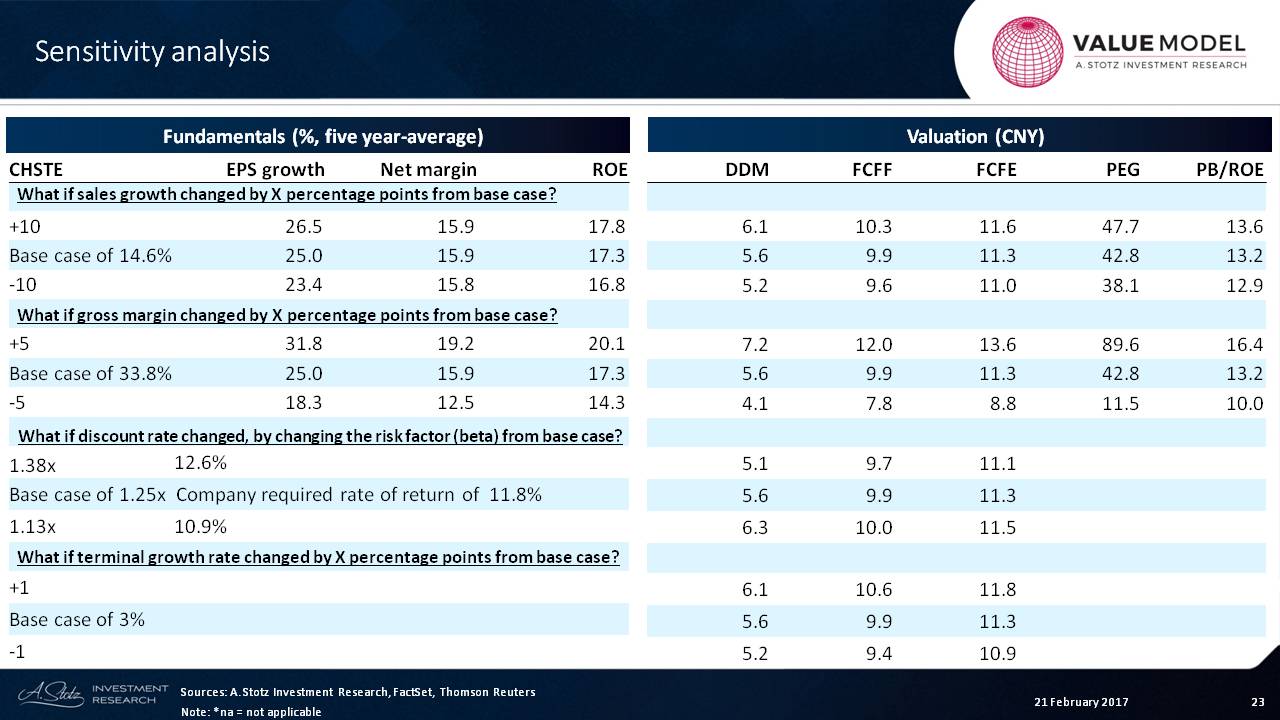
The last thing we’ll look at is the sensitivity analysis where I look at three variables: sales growth change, gross margin change or profitability and discount rate change or terminal growth rate change.
Let’s start with terminal growth.
Terminal growth change does not have anything to do with the fundamentals of the business. It only has to do with our valuation.
We’ve chosen a 3% terminal growth. If we were to increase that to a 4% terminal growth, we would see that the dividend discount value would go up slightly from 5.6% to 6.1%. Free cash flow to the firm would go up to 10.6%. And free cash flow to equity would go up to 11.8%
We can also look at our discount rate of 11.8% and say that we raised that discount to 12.6% or bring it down to 10.6%.
And, of course, with a rising discount rate, we can see the values that it will cost on this side of the valuation.
Finally, we can look at things that will affect the fundamentals of the business. In this case, if we saw that sales jumped by 10 percentage points ─ right now we’re at 14.6% but imagine it was 24.6 ─ what impact would that have on EPS growth?
The EPS growth would go to 26.5%!
And we can look at the DDM value, in particular, and that will go up a bit. That’s about in line. Now, we can see a little bit of difference here where this goes to 10.3% versus 10.65%.
I would say that it’s not highly sensitive to these changes.
That gives you an idea of the value of this company, China High Speed Transmission Group Company Limited.
Check out the World Class Benchmarking of China High Speed Transmission Group
Let me know if you have any questions or comments. Also, please mention things that you would like to learn or companies you’d like to see a valuation learning session on in the future.