Relationships between Stocks, Bonds, Gold, Oil, US Dollar, and Inflation
Are there any relationships? What are they?
We investigated the pairwise correlation using monthly data starting from December 1989.
- Stock market returns (World and US)
- Bond yield (World)
- Gold price
- Oil price
- US dollar index
- Inflation (World CPI)
We also looked at 10-yr rolling correlations to see what has changed over time.
How to interpret correlation coefficients
Positive coefficient, positive relationship.
- >70%: Strong positive relationship
- >50%: Moderate positive relationship
- >30%: Weak positive relationship
No linear relationship if between -30% and 30%.
Negative coefficient, negative relationship.
- <-30%: Weak negative relationship
- <-50%: Moderate negative relationship
- <-70%: Strong negative relationship
The pairwise correlation
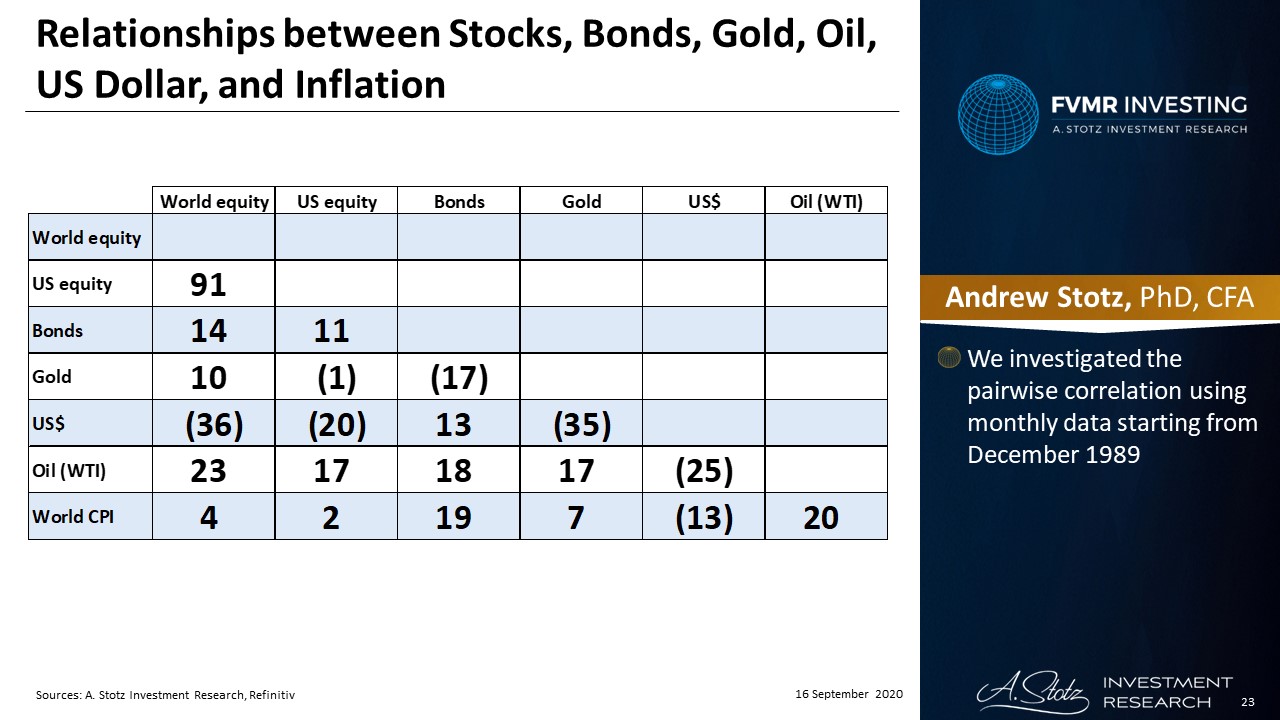
Obviously strong relationship between World equity and US equity. We know that equities are highly correlated as US equity is the majority of world equity.
Bonds don’t show any strong relationships, hence, uncorrelated and you get diversification benefits from adding bonds to your portfolio. Looking at the 10-year rolling correlation, we can see that bonds have been uncorrelated to equity over time as well.
Gold is uncorrelated to all except the US dollar. You get diversification benefits from adding gold to your portfolio. Gold has a negative correlation to the US dollar, as we look at gold in terms of US dollar, a weaker dollar means a higher US$/oz t price.
The US dollar has mostly negative relationships. The US dollar should have a negative relationship to oil, as oil is traded in US$, the correlation shows signs of that. There’s a negative relationship between the US dollar and world equity. Dollar down, stocks up?
A weakening US$ should be positive for equities, gold, and oil
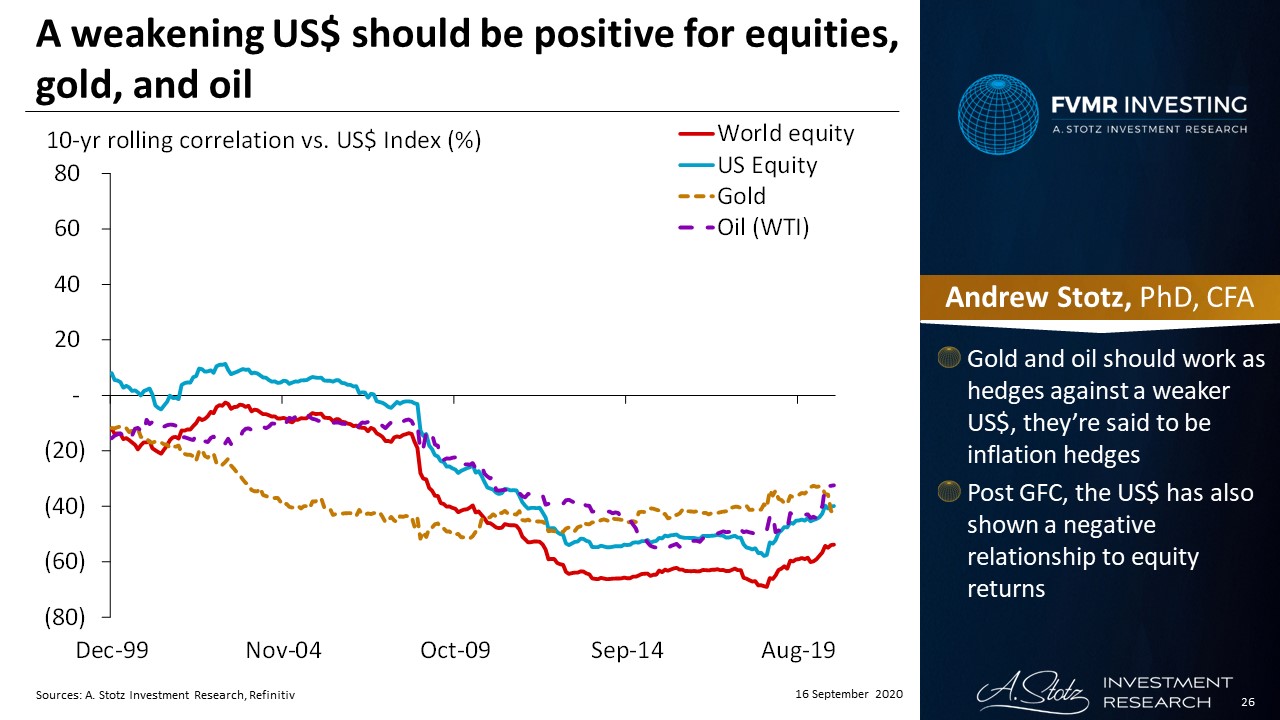
Gold and oil should work as hedges against a weaker US dollar, they’re said to be inflation hedges. Post the Global Financial Crisis, the US dollar has also shown a negative relationship to equity returns.
Relationships are too weak for oil. Relationships are weak which can mean that they have changed over time. It could also mean that there are generally many factors at play all the time. Generally, oil up, stocks up, US dollar down.
Looking at 10-year correlations for oil, some relationships emerge
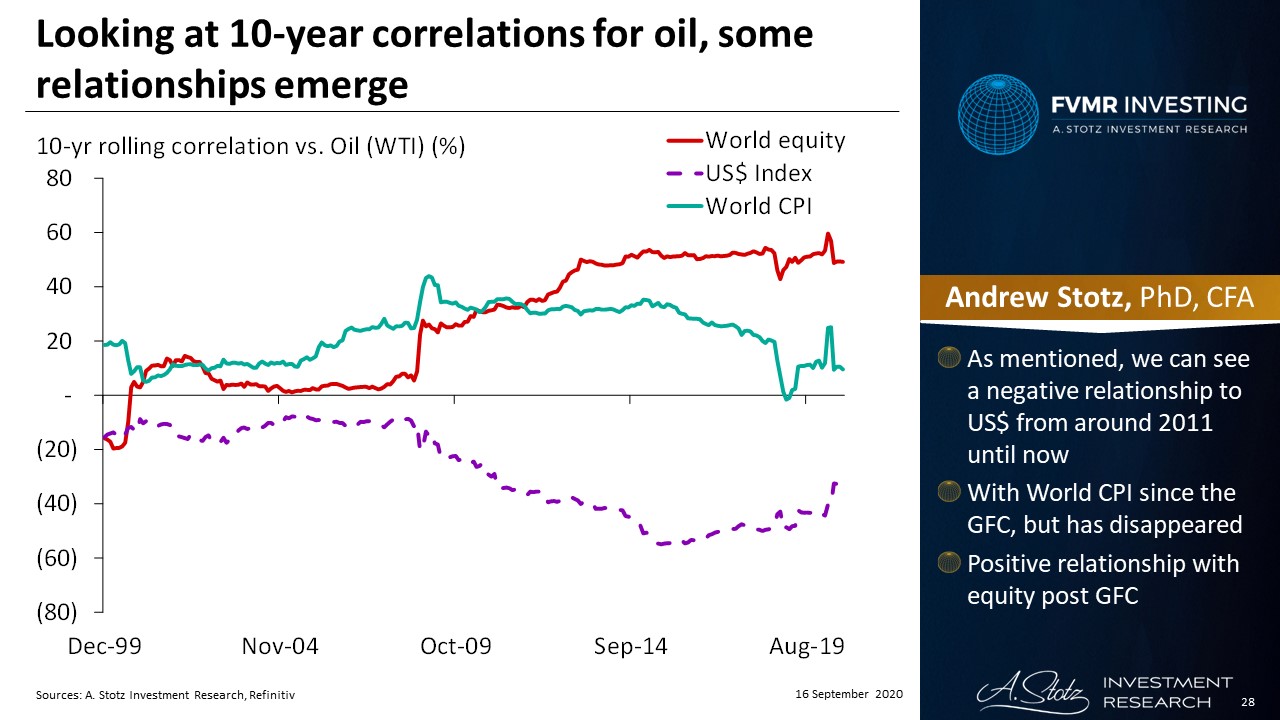
As mentioned, we can see a negative relationship to the US dollar from around 2011 until now. A positive relationship with World CPI since the Global Financial Crisis, but it has disappeared. Also, a positive relationship with equity, following the Global Financial Crisis.
DISCLAIMER: This content is for information purposes only. It is not intended to be investment advice. Readers should not consider statements made by the author(s) as formal recommendations and should consult their financial advisor before making any investment decisions. While the information provided is believed to be accurate, it may include errors or inaccuracies. The author(s) cannot be held liable for any actions taken as a result of reading this article.