A. Stotz All Weather Strategies – May 2026
The All Weather Strategy is available in Thailand through FINNOMENA. Please note that this post is not investment advice and should not be seen as recommendations. Also, remember that backtested or past performance is not a reliable indicator of future performance.
In May 2026, World Equity was up 5.2%
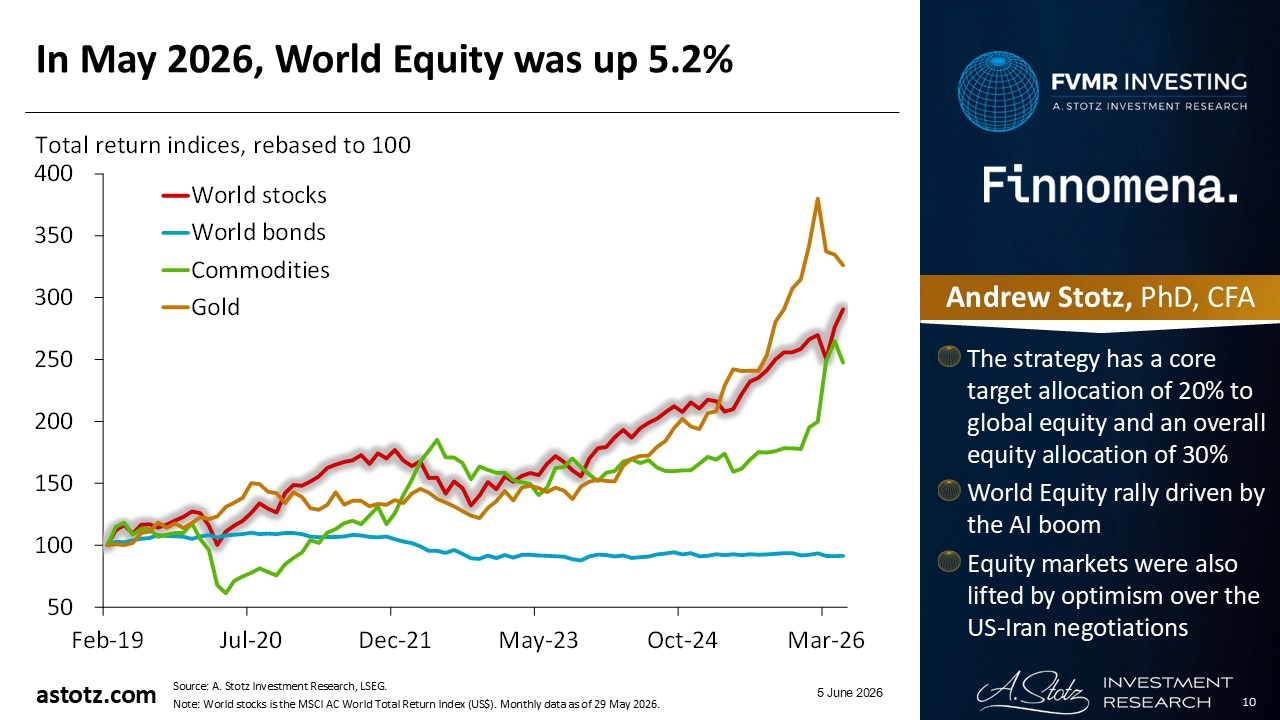
- The strategy has a core target allocation of 20% to global equity and an overall equity allocation of 30%
- World Equity rally driven by the AI boom
- Equity markets were also lifted by optimism over the US-Iran negotiations
Performance of the World stock markets
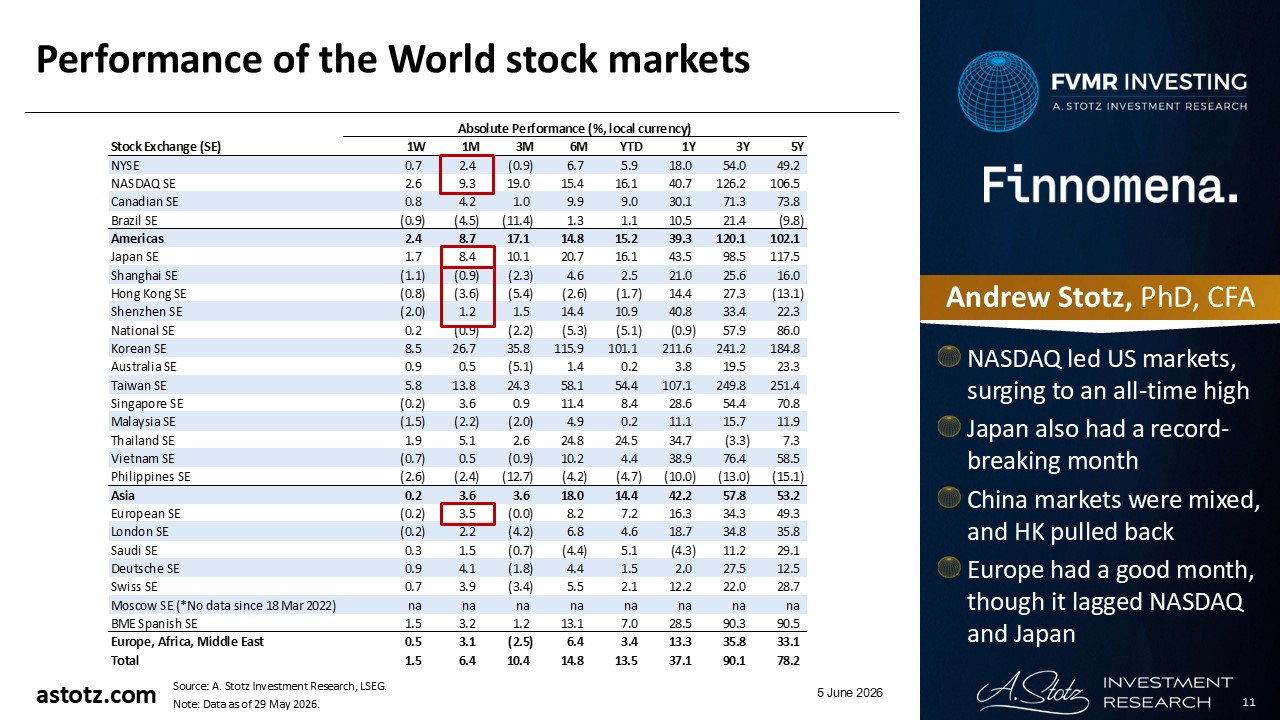
- NASDAQ led US markets, surging to an all-time high
- Japan also had a record-breaking month
- China markets were mixed, and HK pulled back
- Europe had a good month, though it lagged NASDAQ and Japan
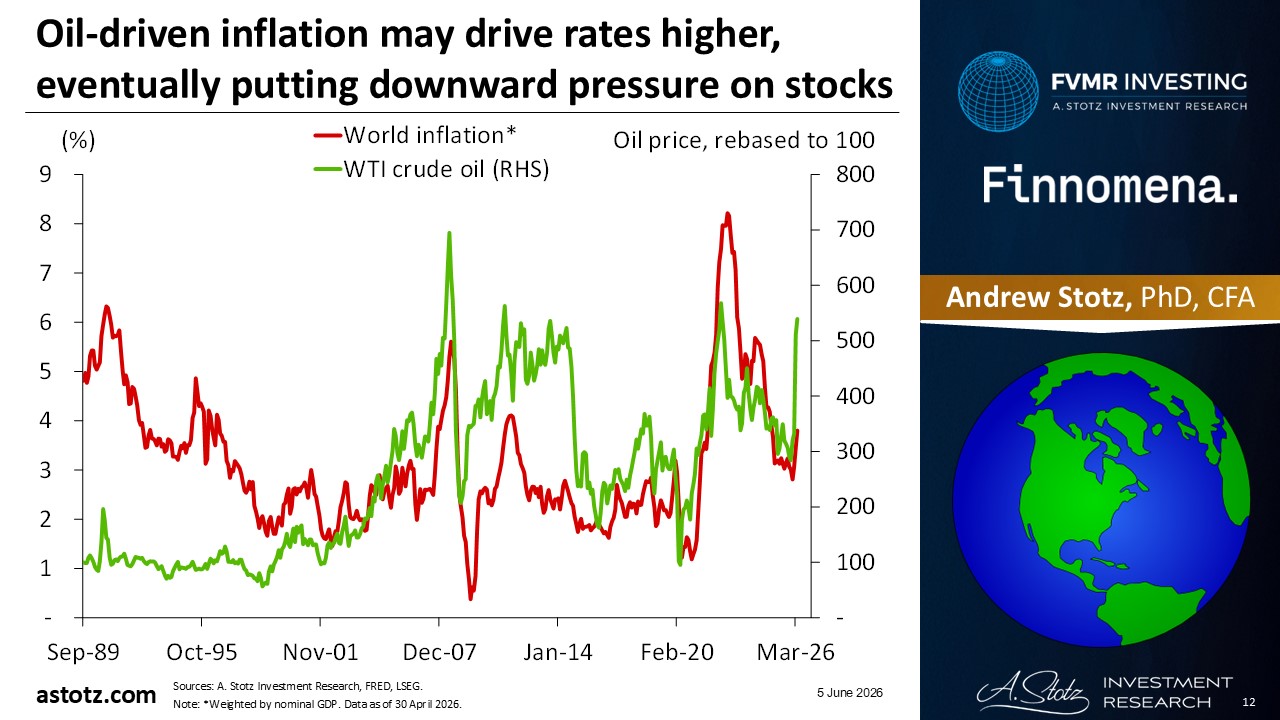
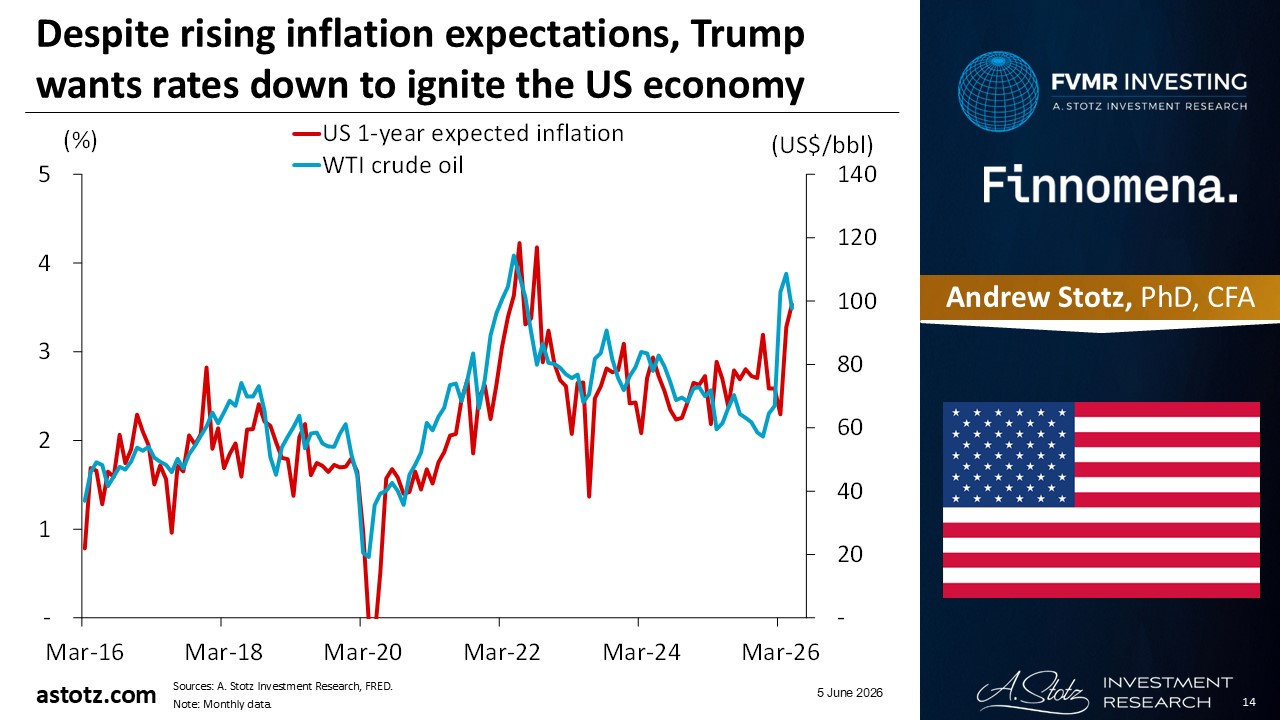
Oil-driven inflation may drive rates higher, eventually putting downward pressure on stocks
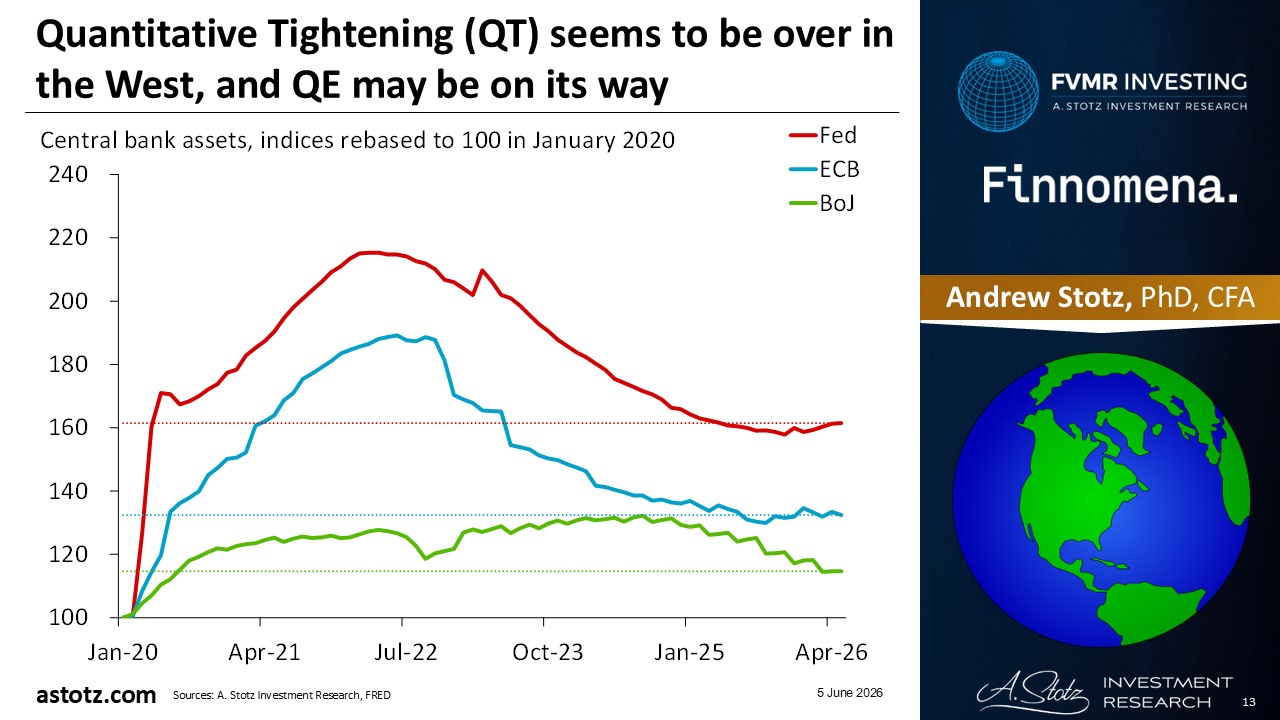
Quantitative Tightening (QT) seems to be over in the West, and QE may be on its way
Despite rising inflation expectations, Trump wants rates down to ignite the US economy
US debt has doubled since GFC; the high interest rates make debt service much more expensive
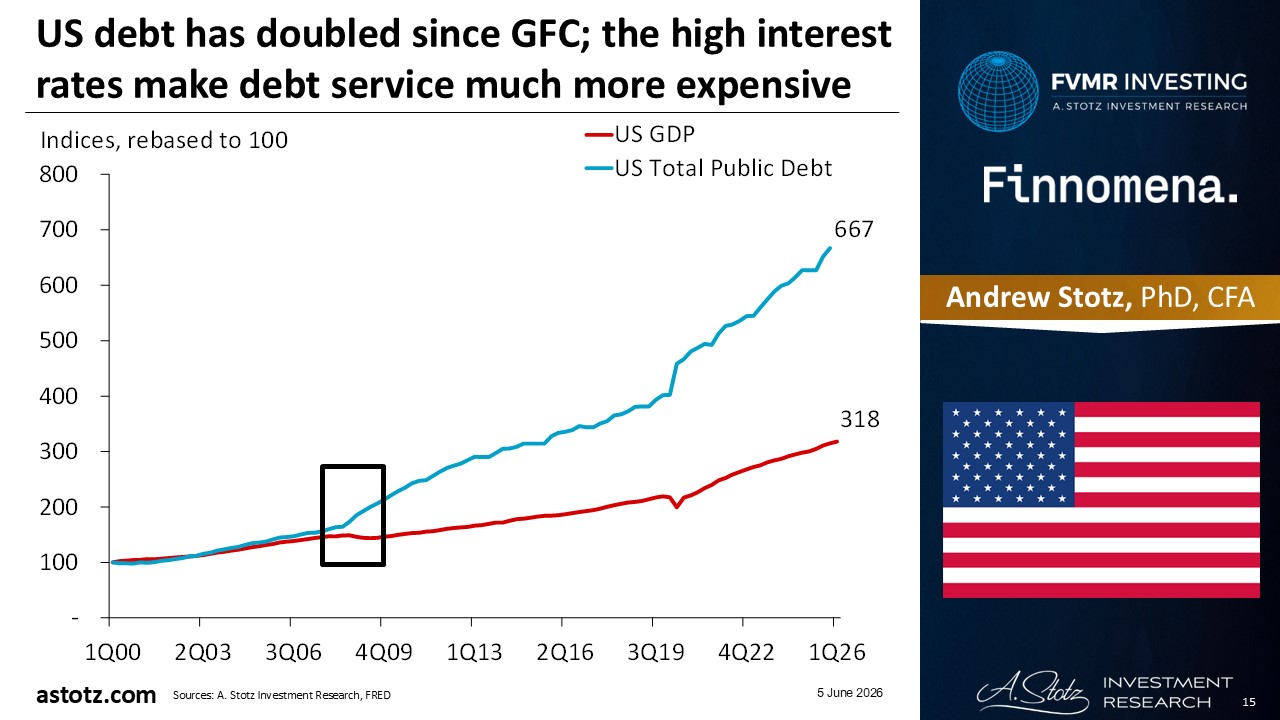
US won’t go bankrupt, they can just print more money and inflate away debt

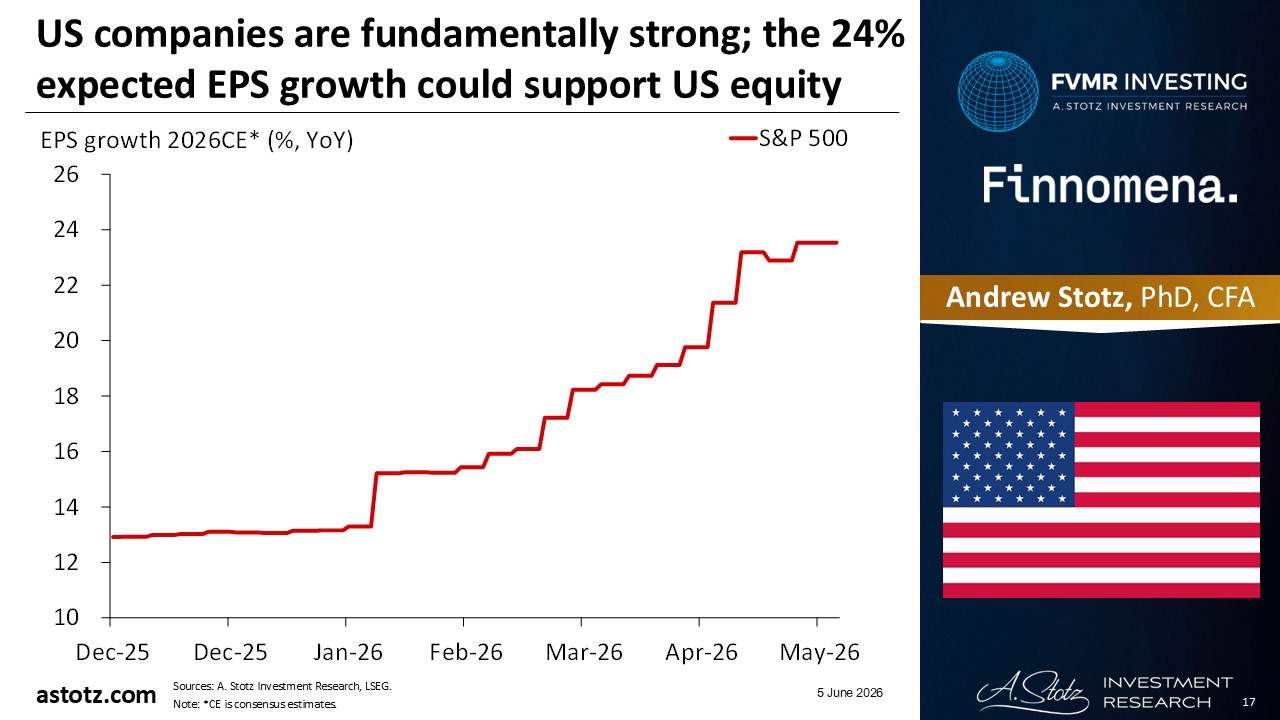
US companies are fundamentally strong; the 24% expected EPS growth could support US equity
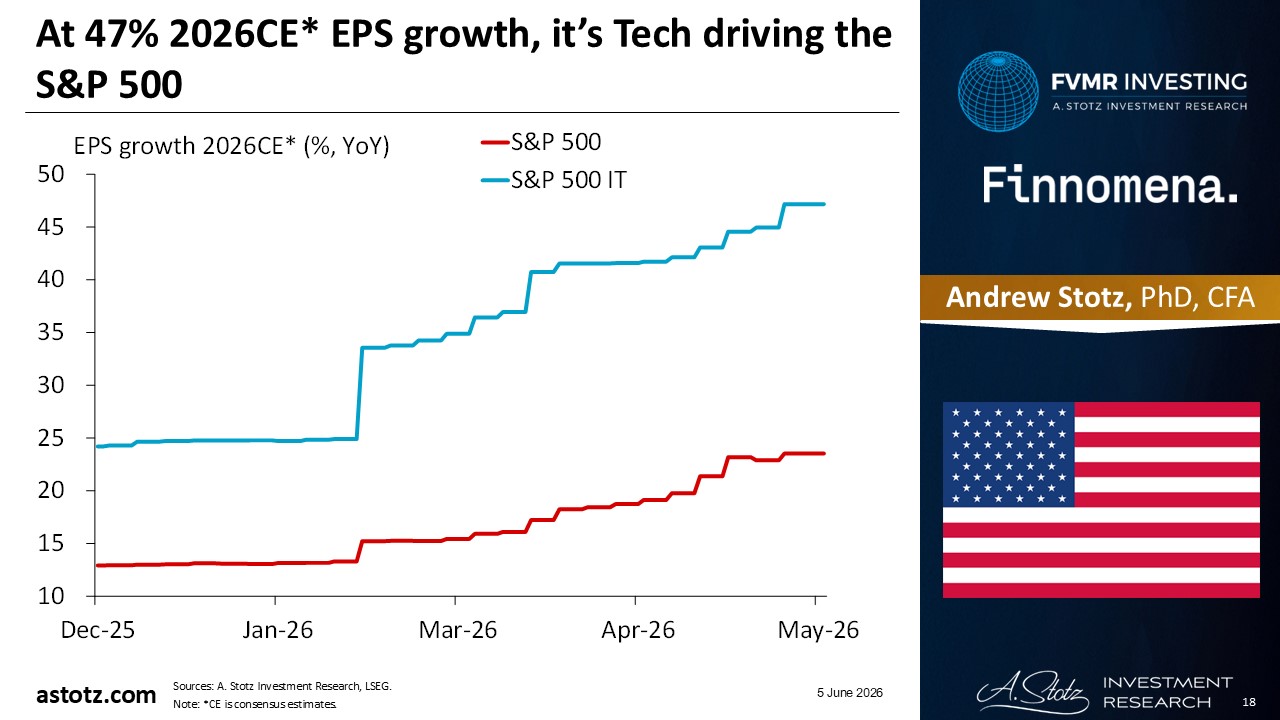
At 47% 2026CE* EPS growth, it’s Tech driving the S&P 500
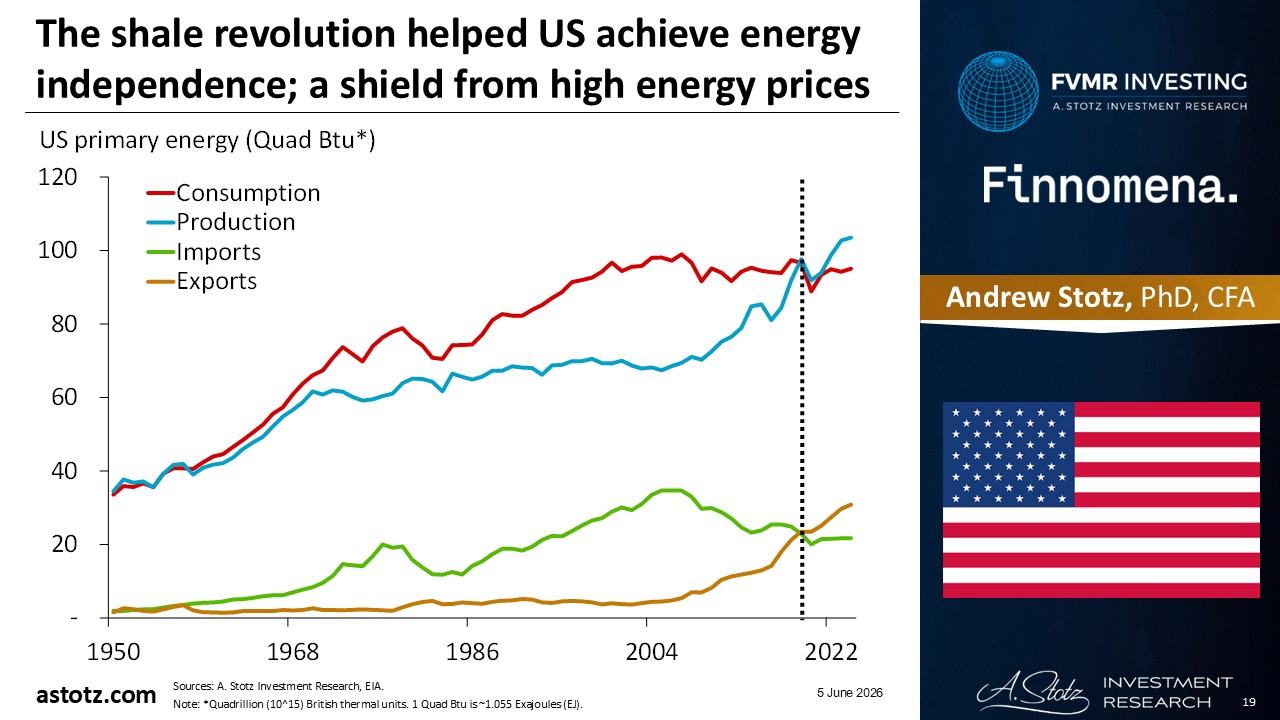
The shale revolution helped US achieve energy independence; a shield from high energy prices
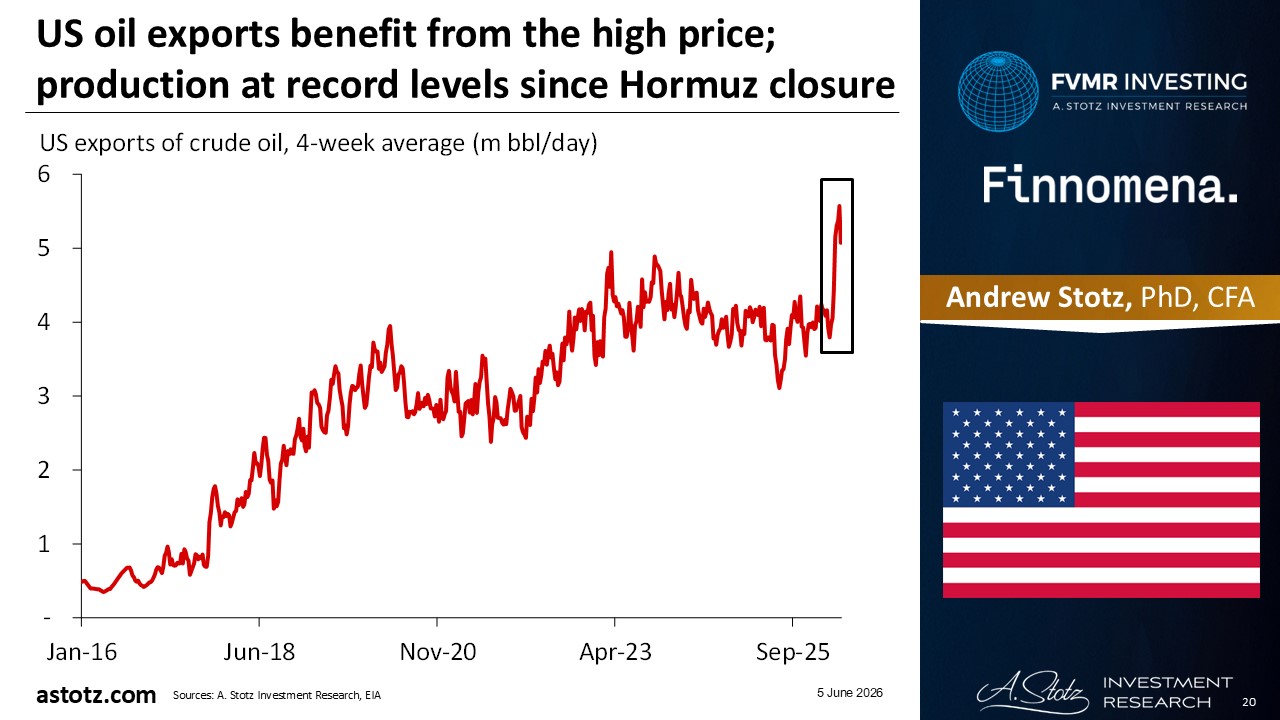
US oil exports benefit from the high price; production at record levels since Hormuz closure
Even though the US is facing many challenges, the market is typically considered resilient
- The US also appears stronger than other developed markets like Europe and Japan
- We have exposure to US equity through the global equity core allocation
- We add an additional 25% tilt as the US can remain strong relative to other stock markets
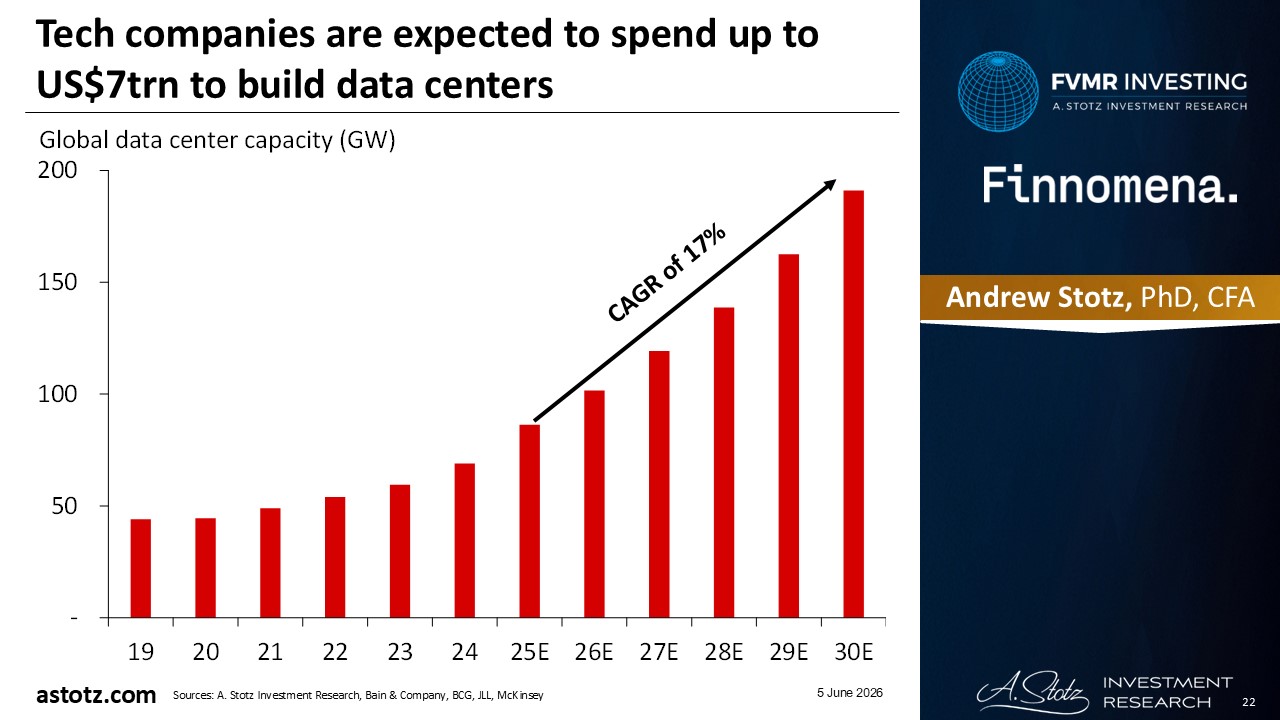
Tech companies are expected to spend up to US$7trn to build data centers
The rapid construction of data centers is one example of how Tech drives the overall market
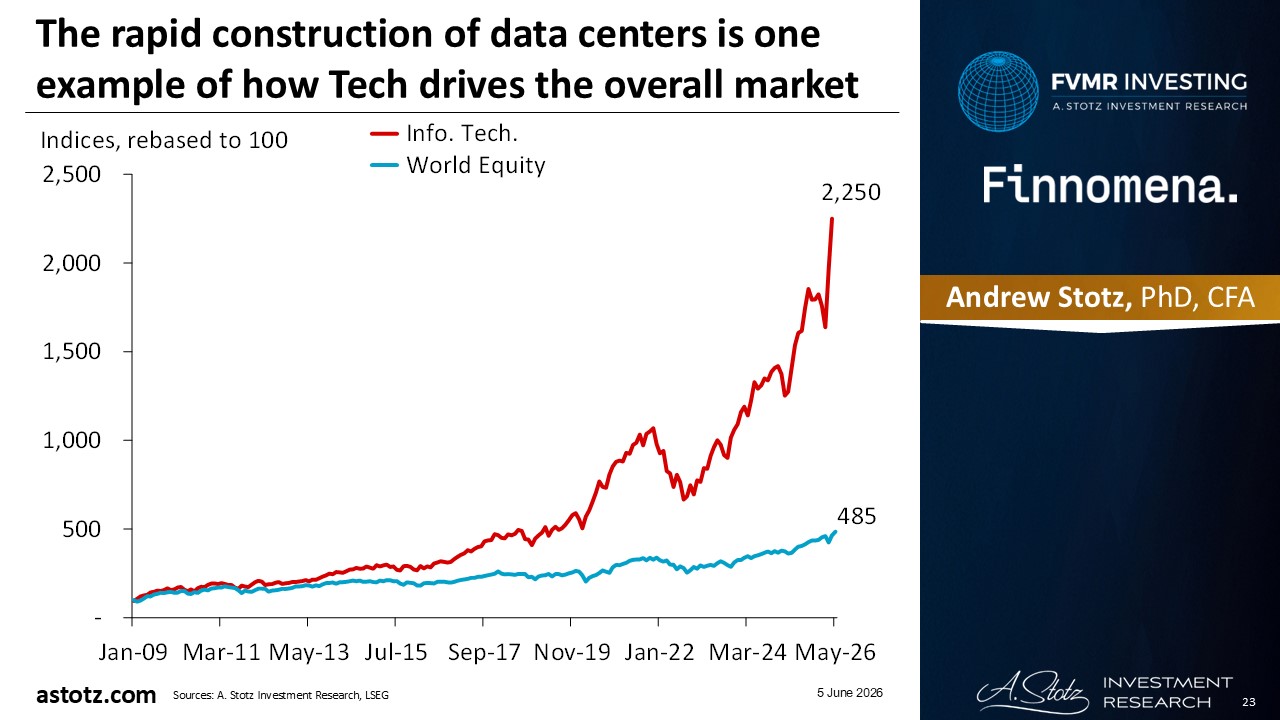
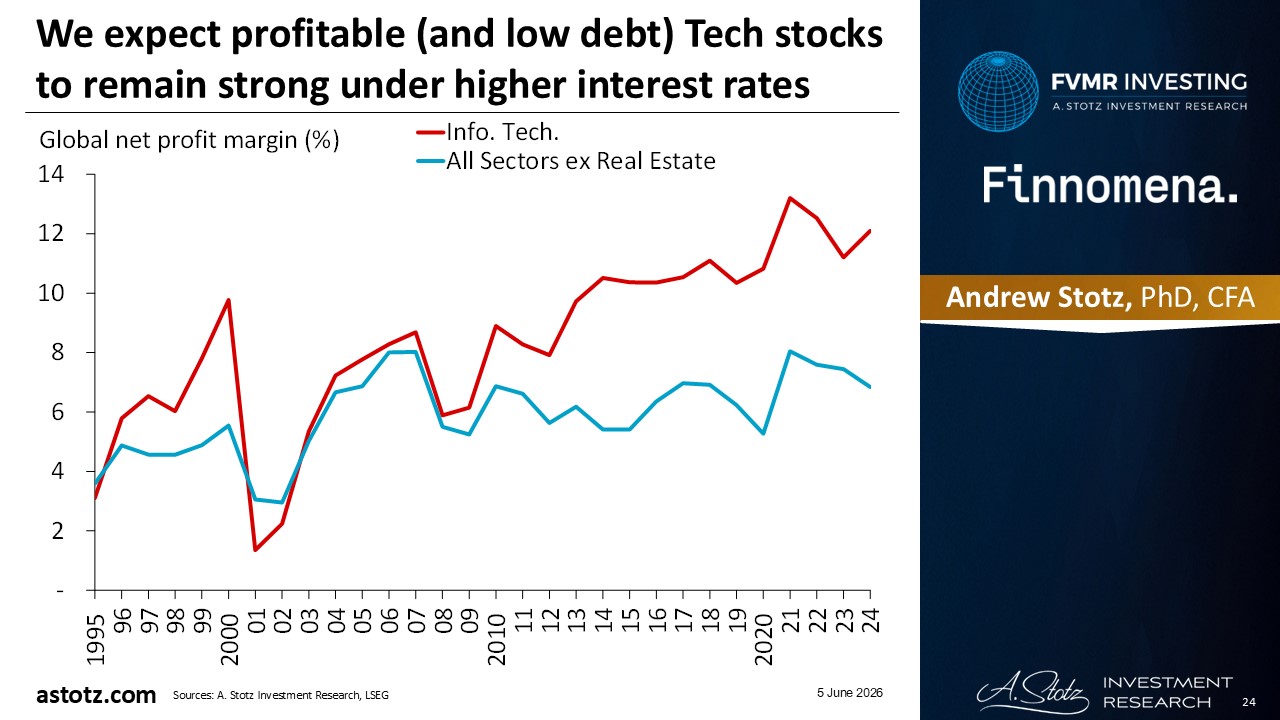
We expect profitable (and low debt) Tech stocks to remain strong under higher interest rates
The AI boom is the biggest opportunity (and risk)
- AI infrastructure spending benefits companies like Nvidia, TSMC, Samsung Electronics, Broadcom, ASML, Micron, SK Hynix, and AMD
- Software companies like Microsoft, Oracle, and SAP stand to capitalize on AI adoption in businesses around the world
- The global fund we use (TLA-GEQ) has a tilt to Global Tech in its Alpha portion
- In addition, we maintain our 5% tilt to World Info. Tech.
Keep a 25% tilt to Asia Pacific ex Japan ex China, which benefits from AI, EV, and Tech optimism
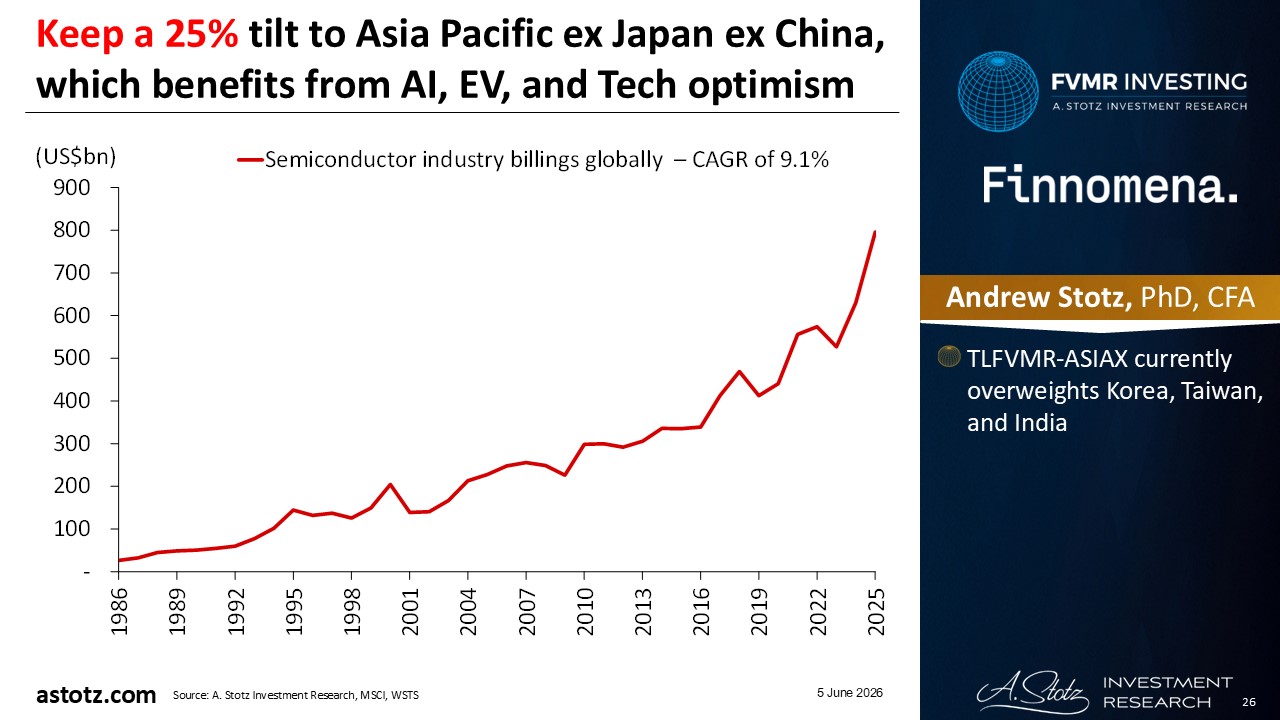
- TLFVMR-ASIAX currently overweights Korea, Taiwan, and India
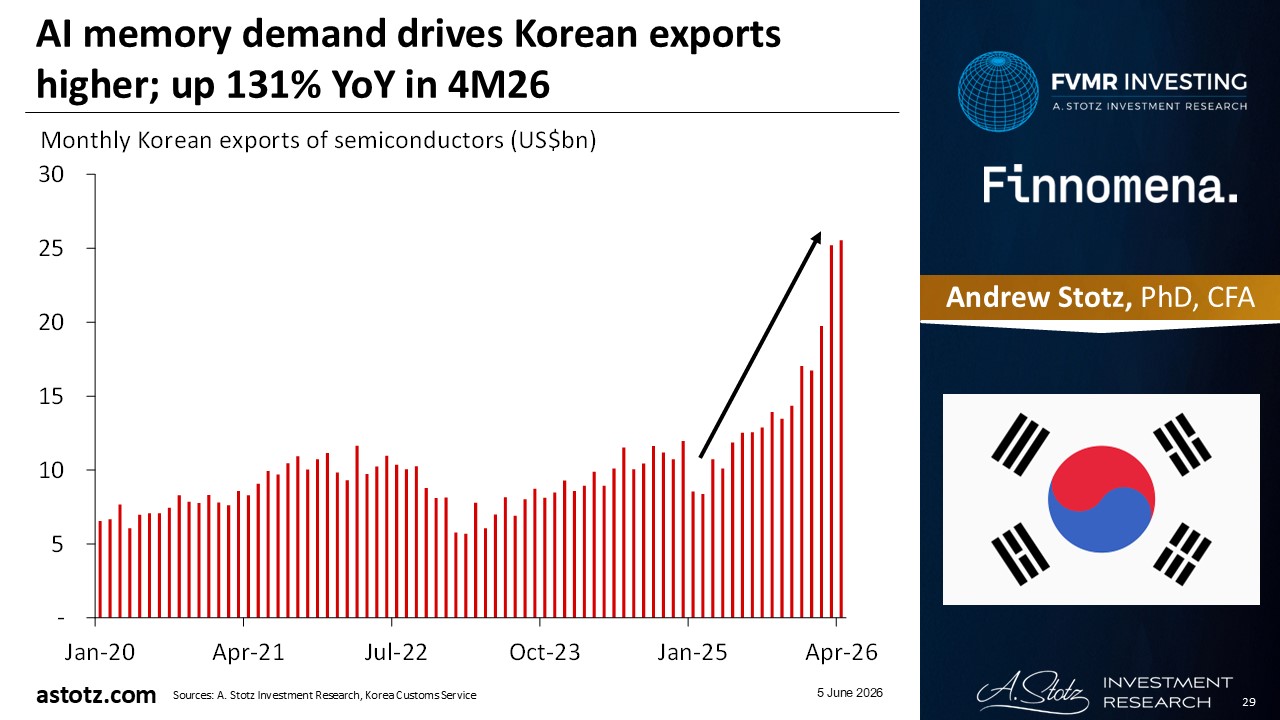
Samsung and SK Hynix dominate the DRAM market at a 68% global market share
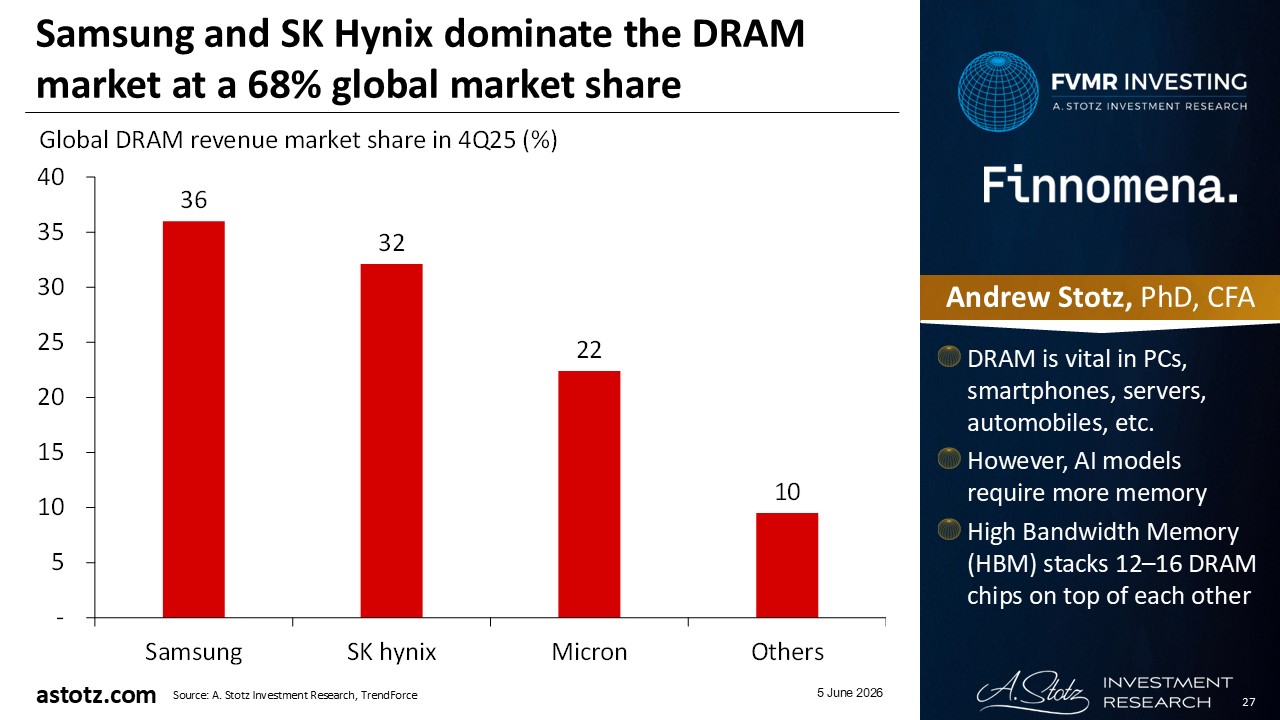
- DRAM is vital in PCs, smartphones, servers, automobiles, etc.
- However, AI models require more memory
- High Bandwidth Memory (HBM) stacks 12–16 DRAM chips on top of each other
SK Hynix and Samsung are even more dominant in the HBM market with a 79% market share
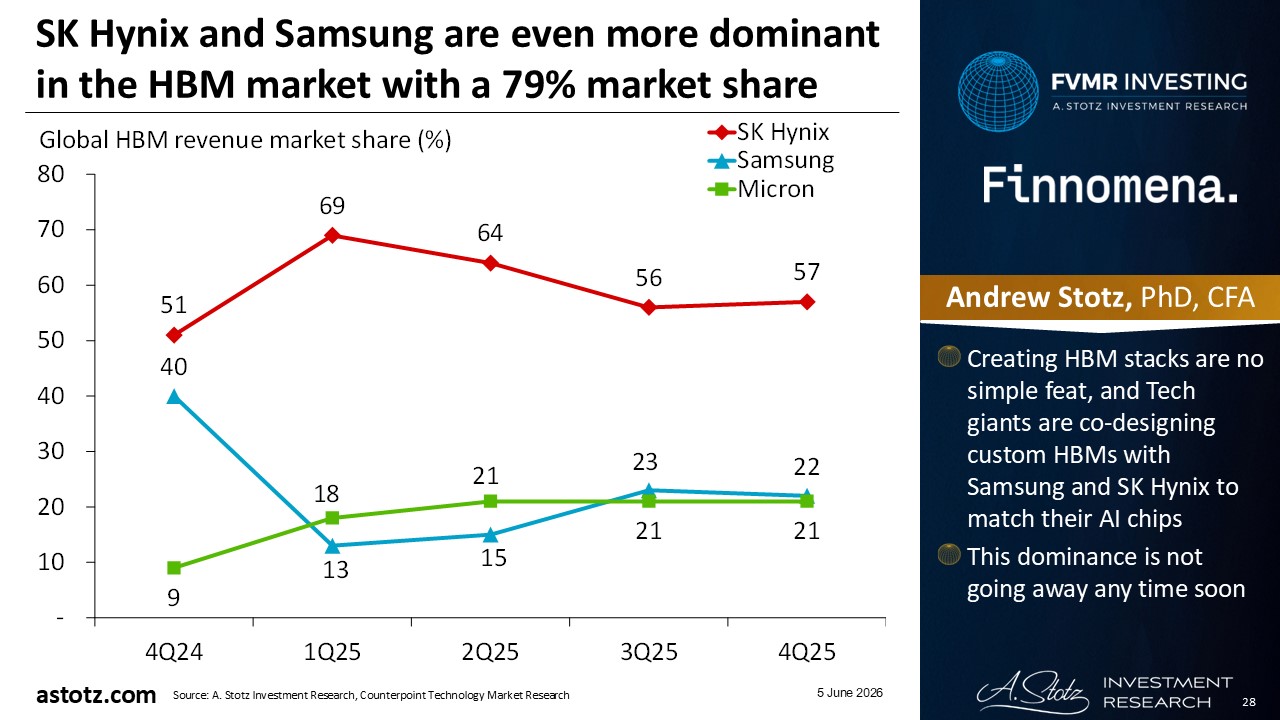
- Creating HBM stacks are no simple feat, and Tech giants are co-designing custom HBMs with Samsung and SK Hynix to match their AI chips
- This dominance is not going away any time soon
AI memory demand drives Korean exports higher; up 131% YoY in 4M26
The Corporate Value-up Program helps reduce the “Korea discount”
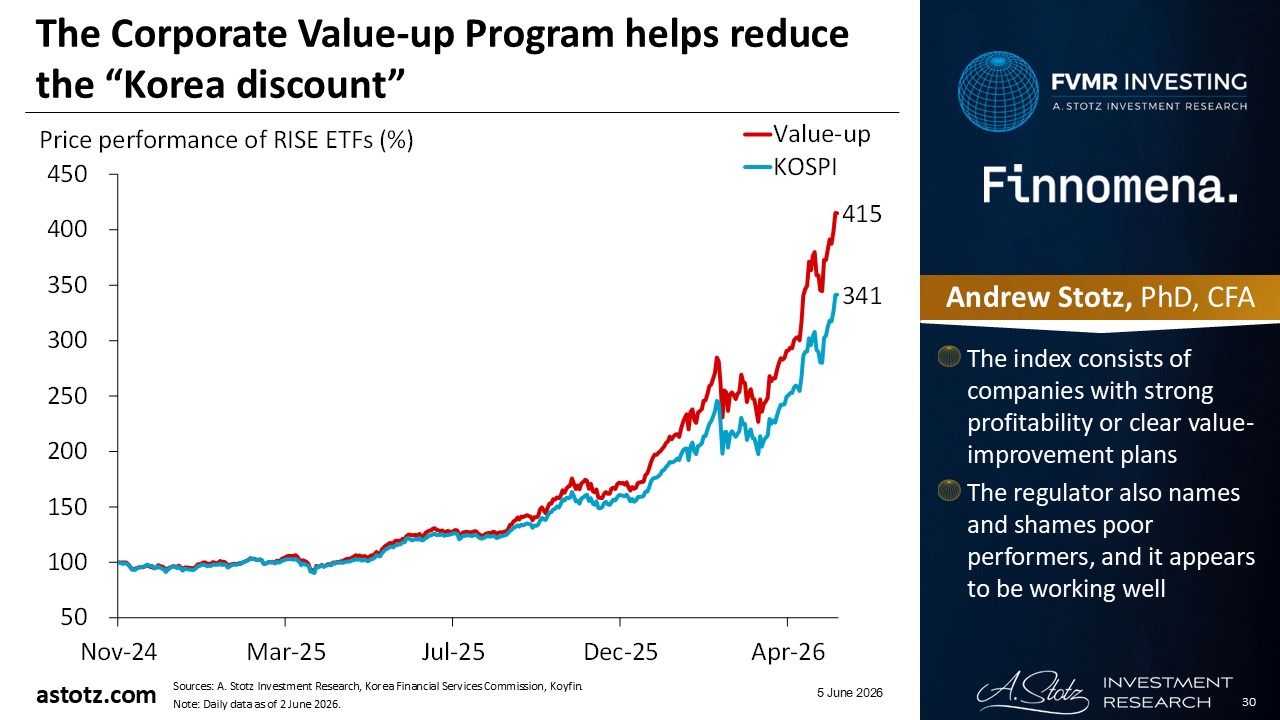
- The index consists of companies with strong profitability or clear value-improvement plans
- The regulator also names and shames poor performers, and it appears to be working well
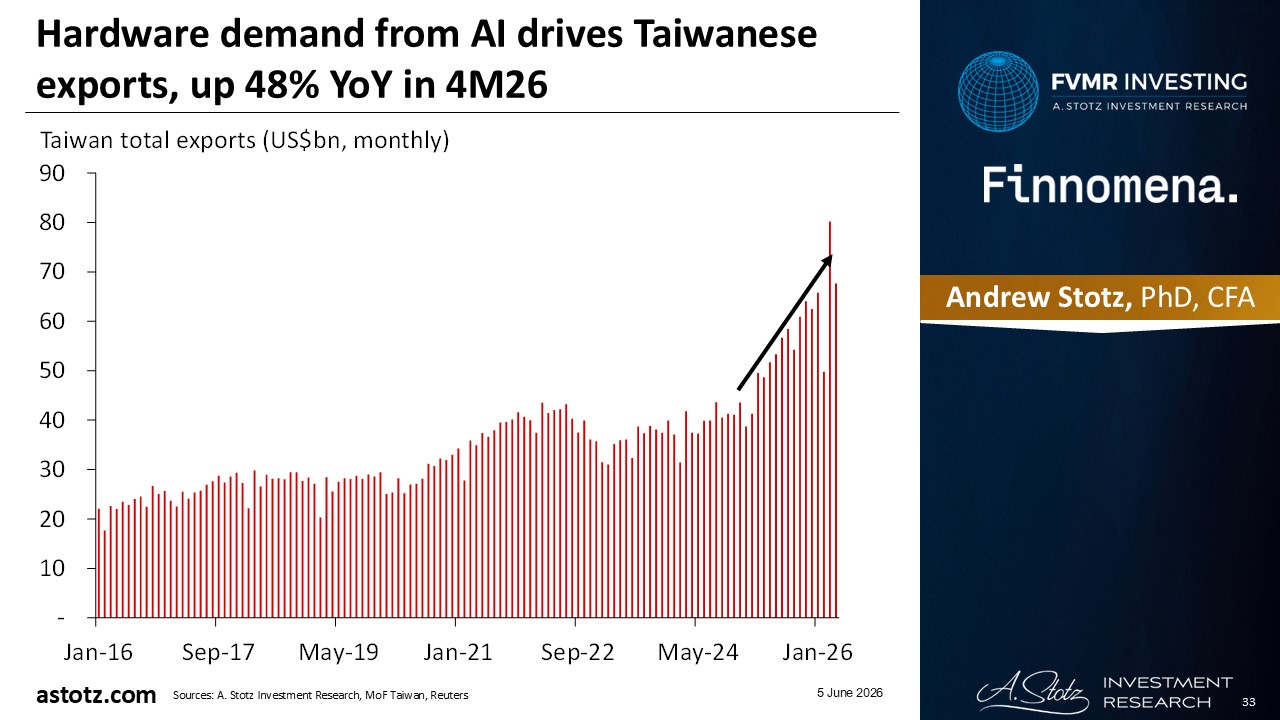
Taiwan dominates processors and servers for the AI boom
- While Korean firms dominate memory, Taiwanese firms like TSMC put the pieces together and builds processors
- Tech giants are increasingly designing their own custom AI chips, and Taiwan is the leader in producing those custom designs
- It’s not only the chips, Taiwanese firms also produce about 90% of the world’s AI servers
TSMC holds 72% of the global market share for advanced nodes (≤16nm)
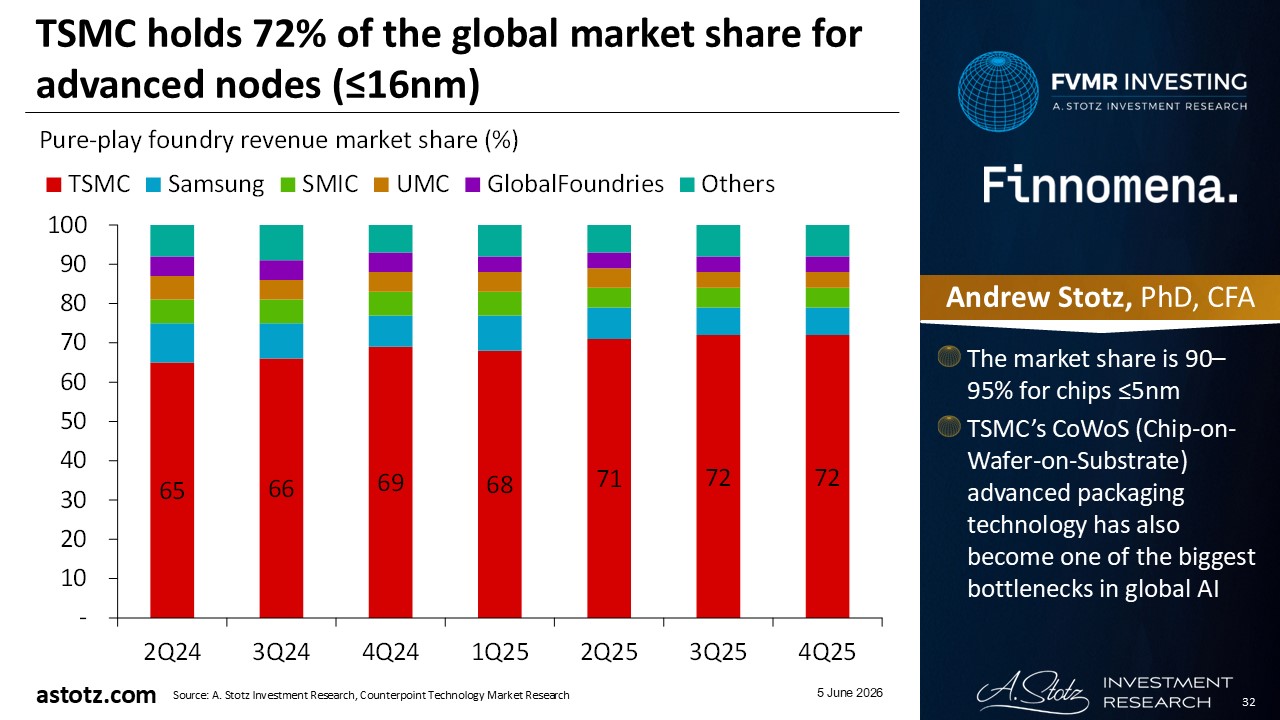
- The market share is 90–95% for chips ≤5nm
- TSMC’s CoWoS (Chip-on-Wafer-on-Substrate) advanced packaging technology has also become one of the biggest bottlenecks in global AI
Hardware demand from AI drives Taiwanese exports, up 48% YoY in 4M26
IMF says India to be the fastest growing economy among the world’s 20 largest in 2026E*
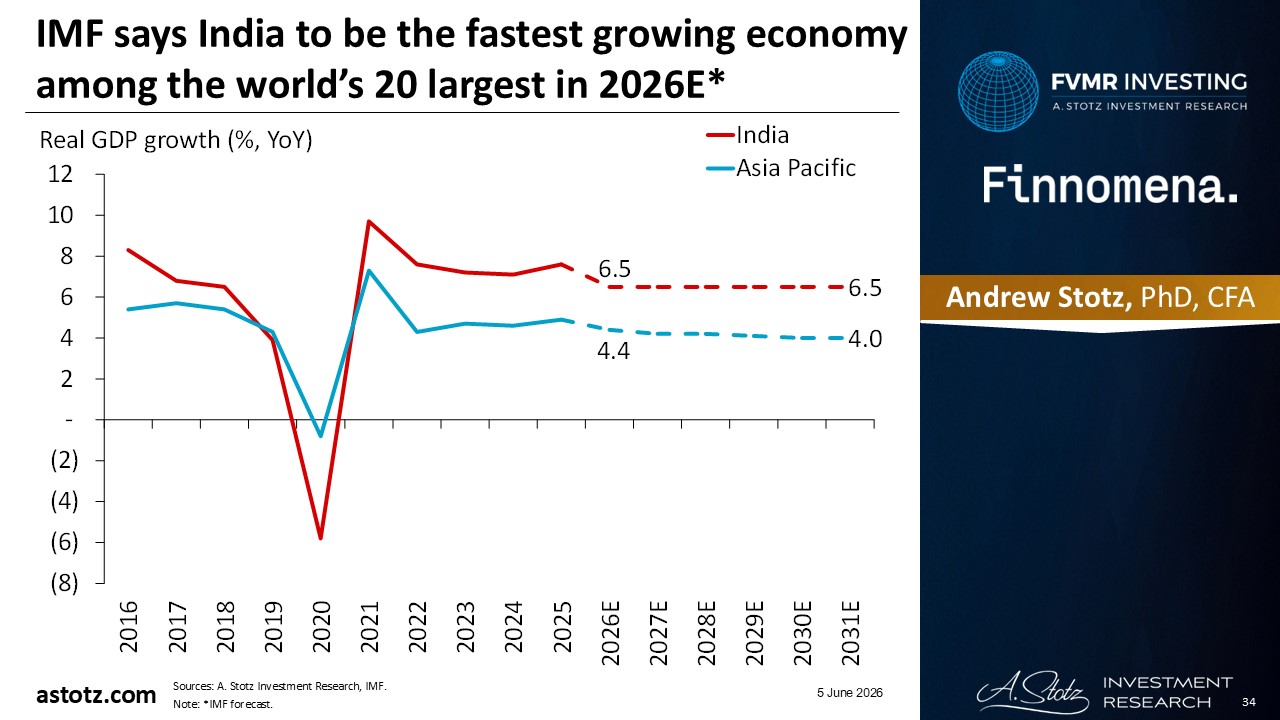
India is the world’s next AI infrastructure destination
- India generates 20% of global data, but has sent almost all of it for storage in foreign hubs
- Legal changes require data to be stored locally
- Gov’t launched a 20-year tax holiday for foreign cloud providers to operate data centers in India tax-free
- An AI infrastructure boom is underway with Big Tech already committing US$126bn to new data center projects in India
Room to scale with data centers using less than 1% of India’s grid
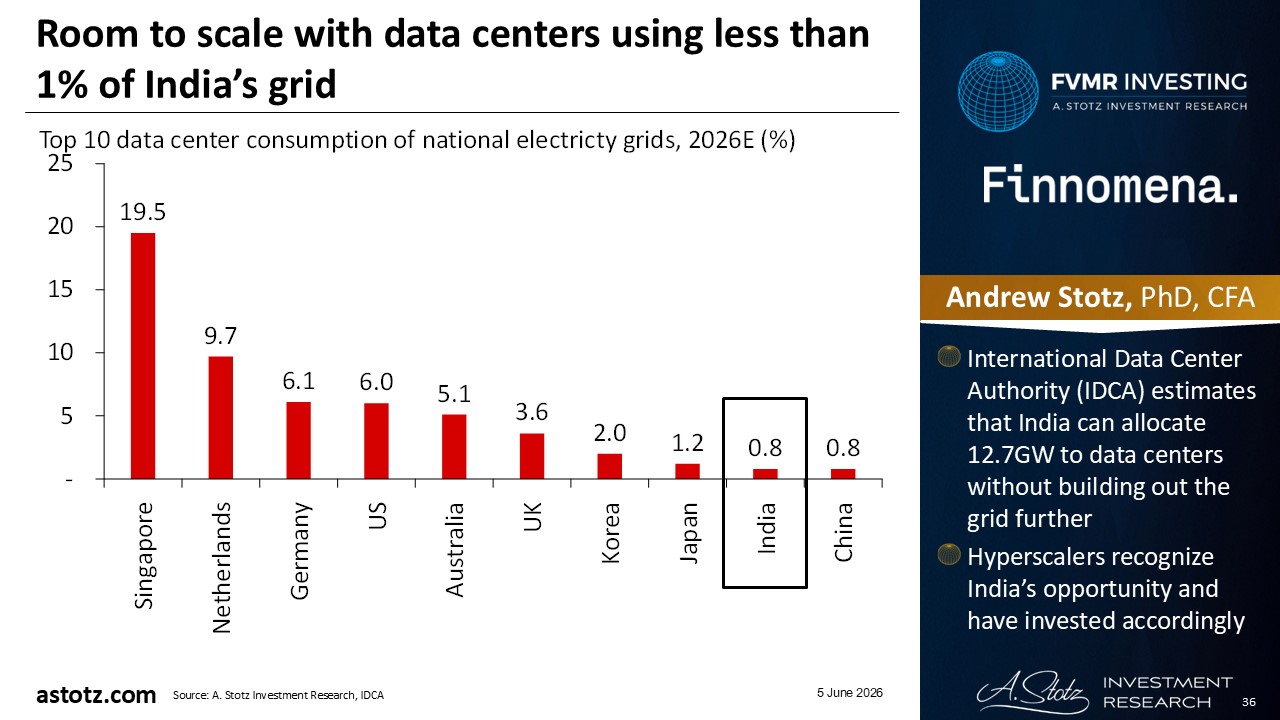
- International Data Center Authority (IDCA) estimates that India can allocate 12.7GW to data centers without building out the grid further
- Hyperscalers recognize India’s opportunity and have invested accordingly
As AI-related stocks hit new highs, there’s a risk of a reversion; we take a more defensive stance
- We reduce the overall equity allocation to 67% from 93%
- Our tilt to Asia Pacific ex Japan ex China and World Info. Tech. still give us AI exposure
- At the same time, we decide to increase our weights in the defensive sectors, World Health Care, and World Infrastructure
Investing in healthcare where demand is fueled by the long-term trend of an ageing population
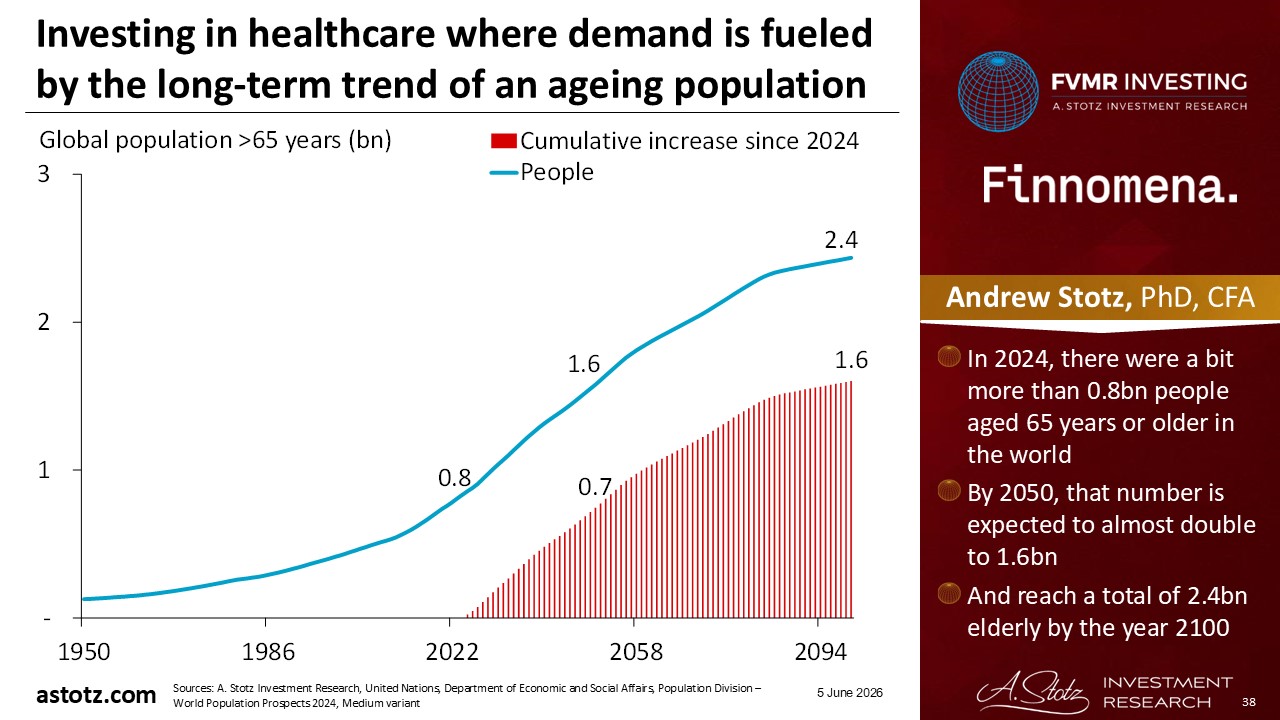
- In 2024, there were a bit more than 0.8bn people aged 65 years or older in the world
- By 2050, that number is expected to almost double to 1.6bn
- And reach a total of 2.4bn elderly by the year 2100
Steady Health Care demand helps revenue hold up better during downturns
- Aging populations need more healthcare, making it a structural growth theme
- We raise our allocation to 13% from 2%
Infrastructure has been defensive, and 46% of the fund* is invested in various Utilities
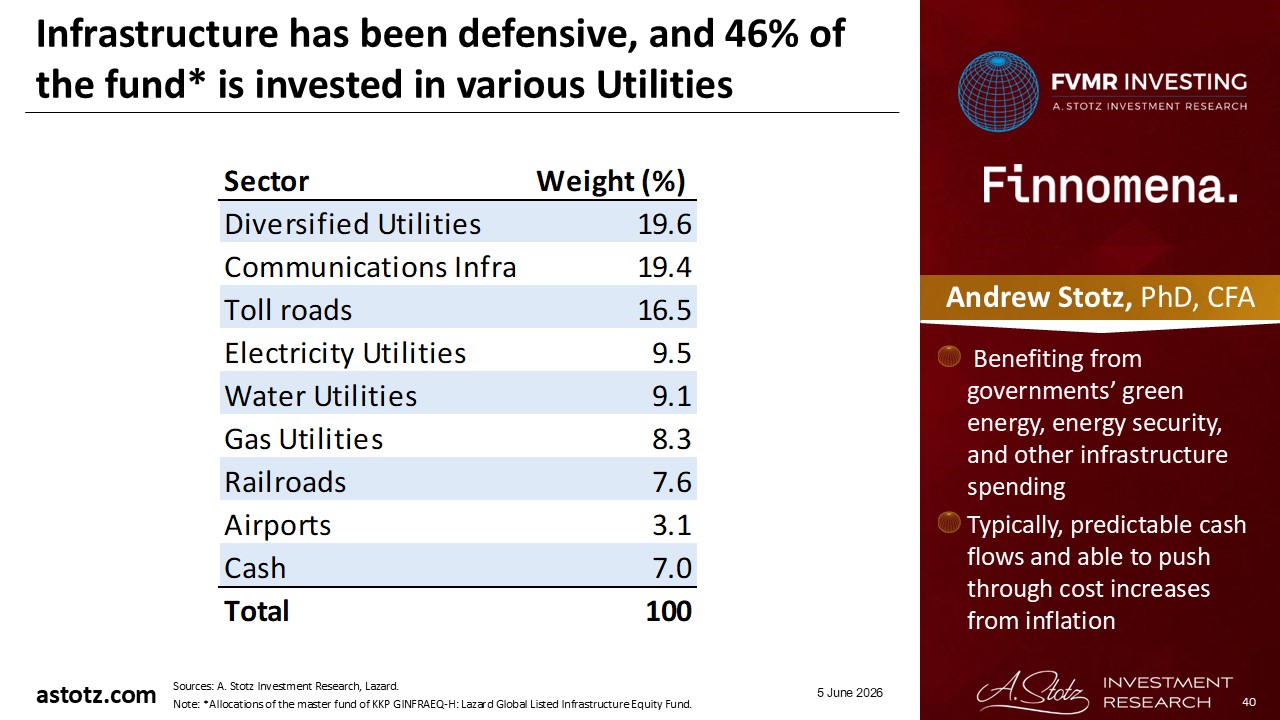
- Benefiting from governments’ green energy, energy security, and other infrastructure spending
- Typically, predictable cash flows and able to push through cost increases from inflation
Utilities are defensive because they provide essentials like electricity, natural gas, and water
- Demand stays stable because households and businesses continue using these services in any economy
- Many utilities also operate under regulated monopoly models, which support predictable cash flows and dividends
- Toll roads, railroads, airports, and communication infrastructure can share similar defensive traits
- We raise our target allocation to World Infrastructure to 13% from 2%
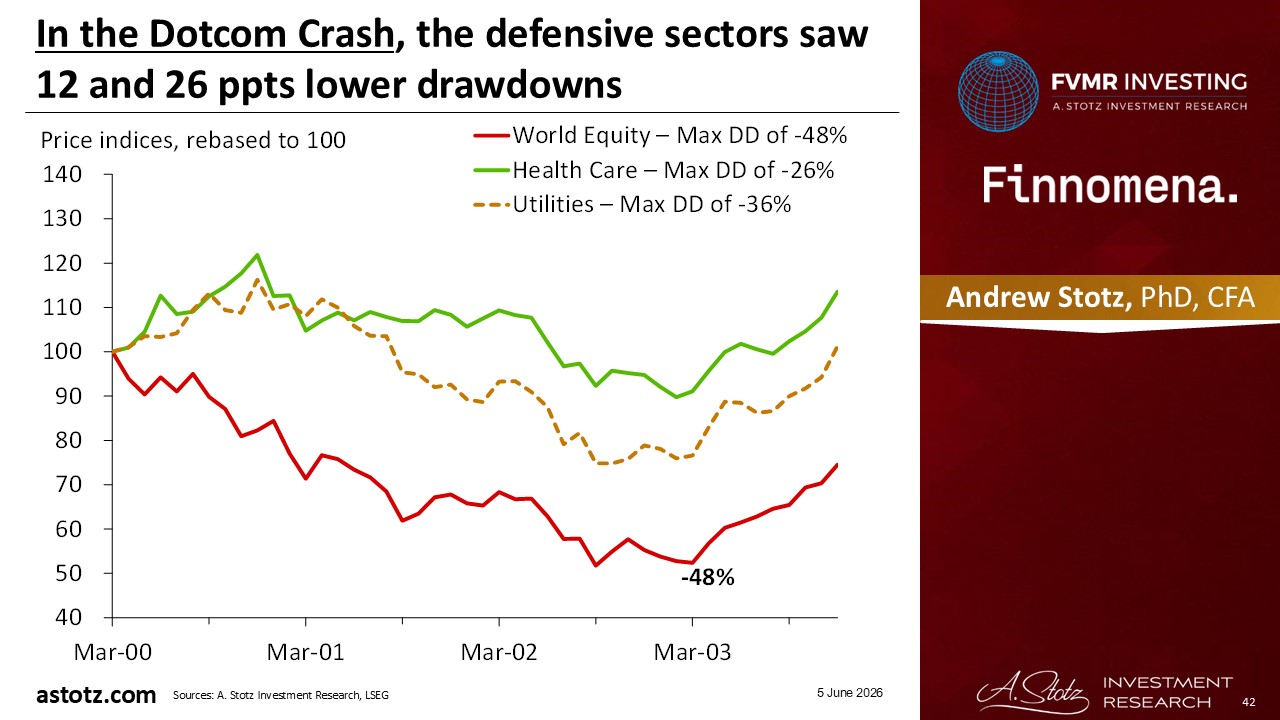
In the Dotcom Crash, the defensive sectors saw 12 and 26 ppts lower drawdowns
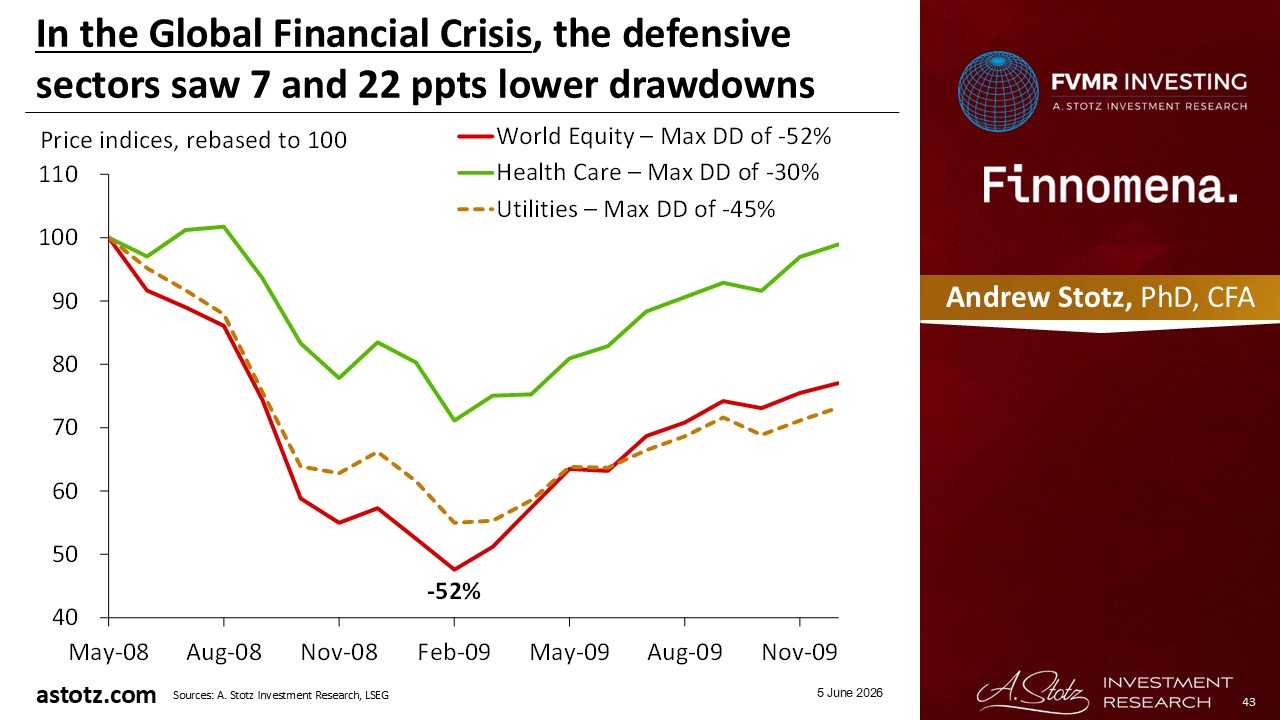
In the Global Financial Crisis, the defensive sectors saw 7 and 22 ppts lower drawdowns
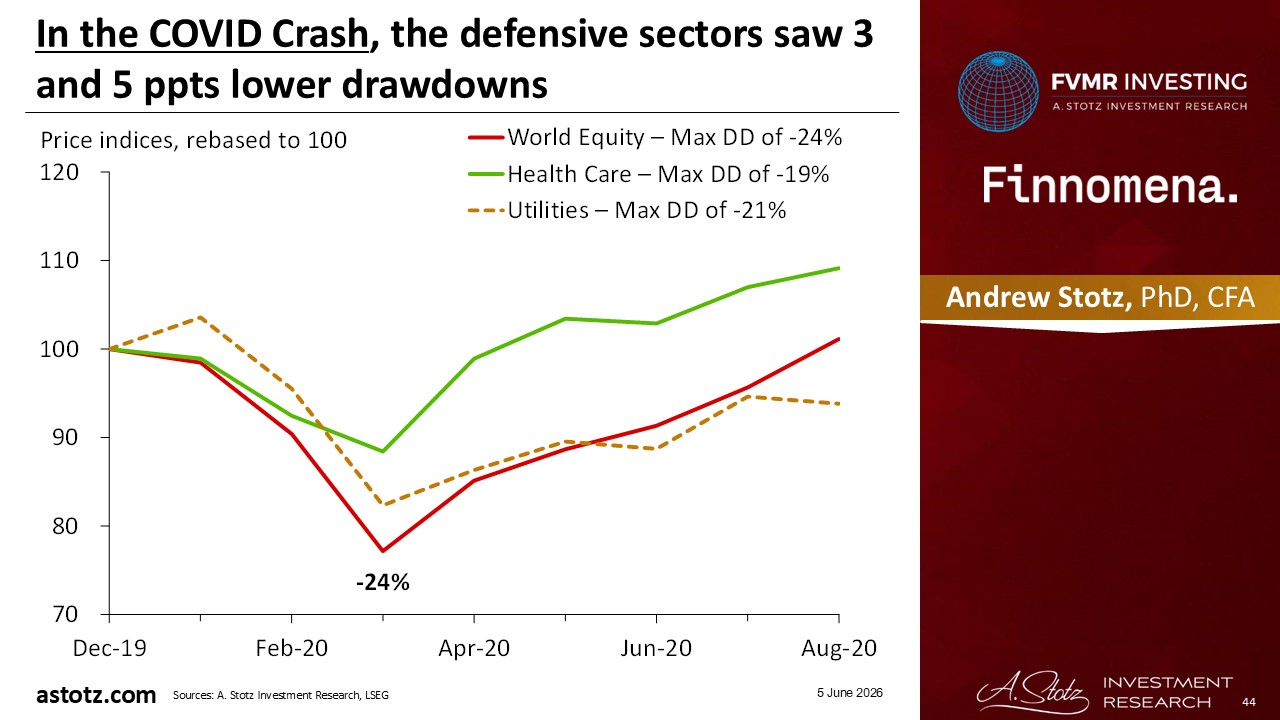
In the COVID Crash, the defensive sectors saw 3 and 5 ppts lower drawdowns
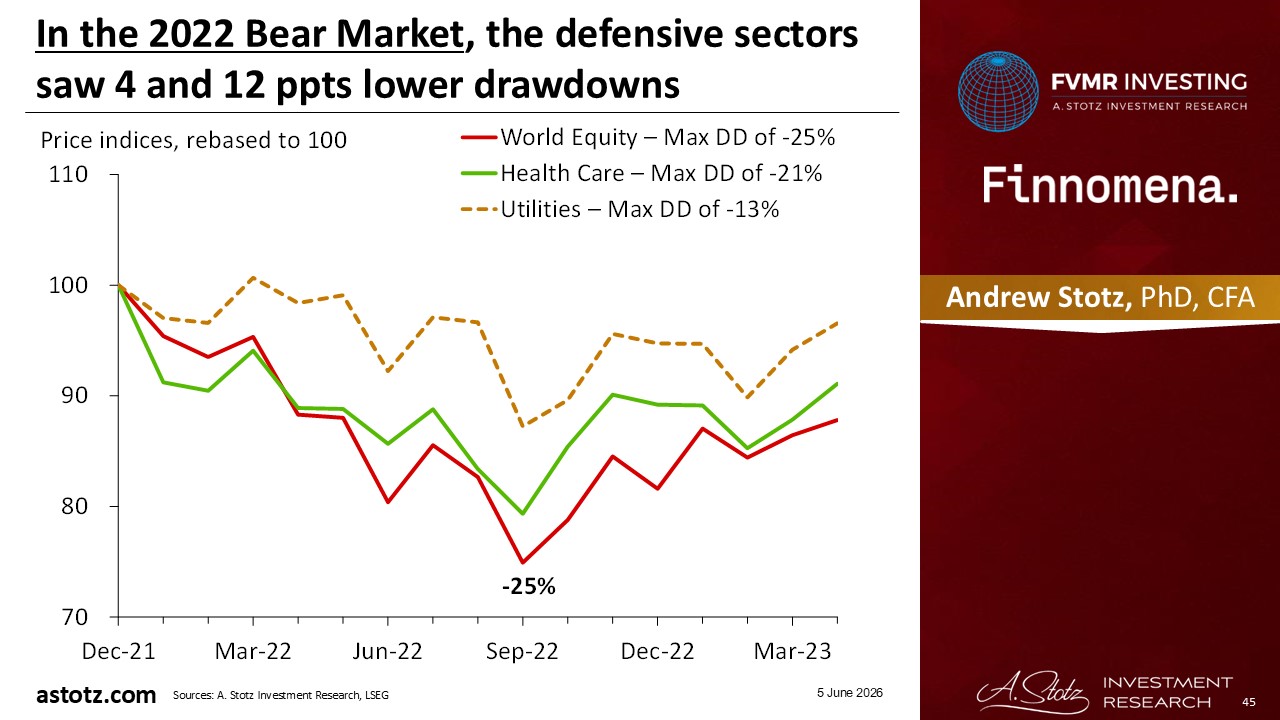
In the 2022 Bear Market, the defensive sectors saw 4 and 12 ppts lower drawdowns
- Fertilizer becomes more expensive, and so does the fuel for farming and transportation
- Historically, 43% of the change in the oil price has been passed through to the food price index
Performance review: All Weather Inflation Guard
All Weather Inflation Guard gained 1.3%
Since inception, the strategy was up 25.3% and 11.7% above a 40/60 portfolio
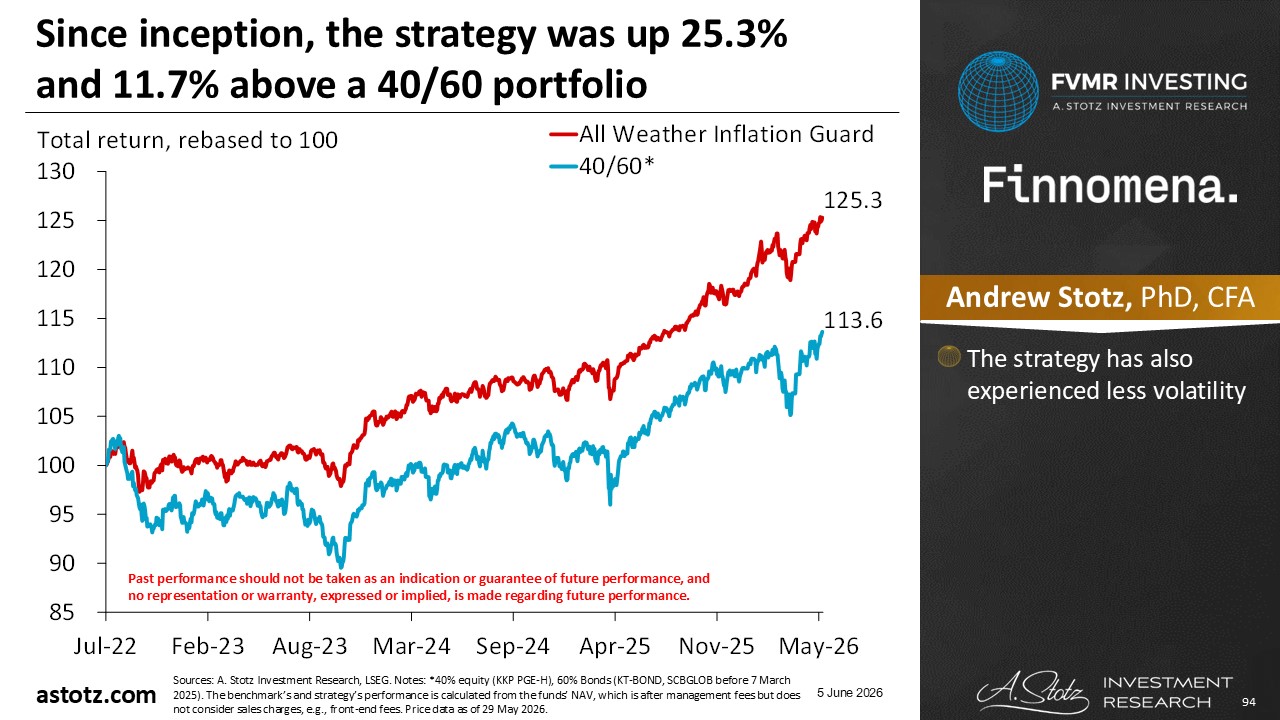
- The strategy has also experienced less volatility
In May 2026, the strategy was up 1.3%, which was 1.0% below the 40/60 portfolio
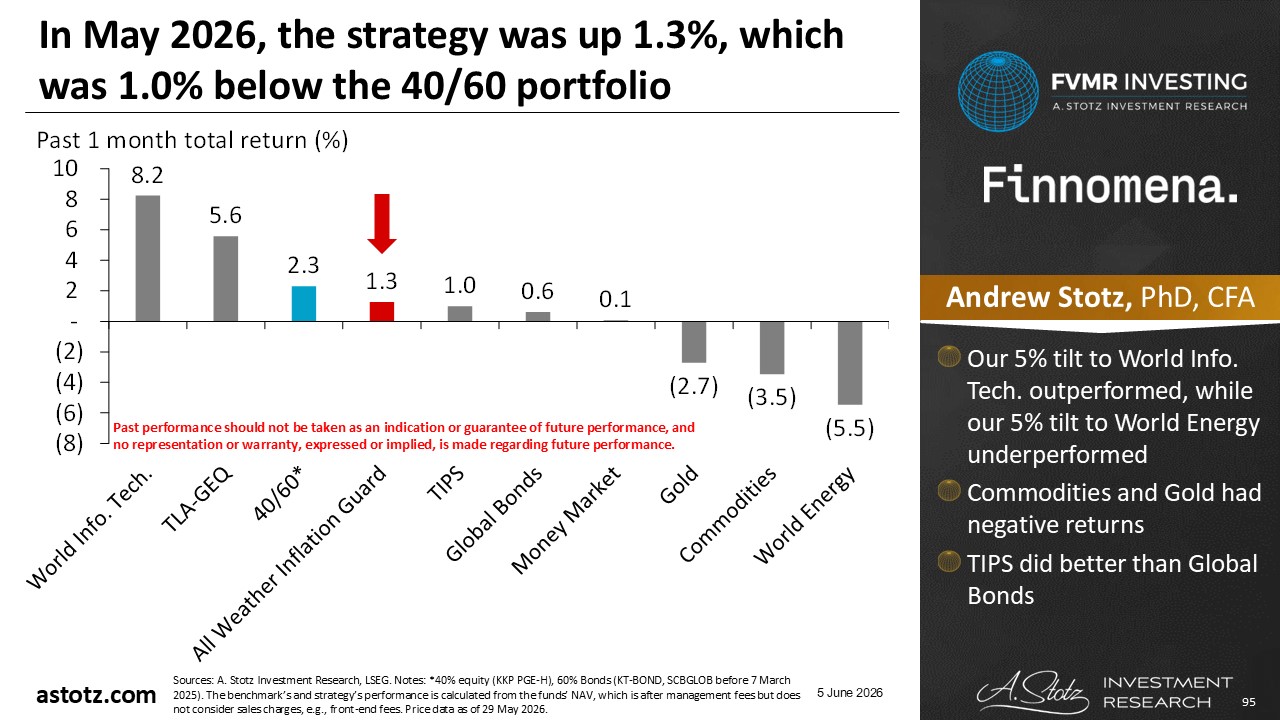
- Our 5% tilt to World Info. Tech. outperformed, while our 5% tilt to World Energy underperformed
- Commodities and Gold had negative returns
- TIPS did better than Global Bonds
Since last revision, the strategy was down 3.2%, which was 1.1% below the 40/60 portfolio
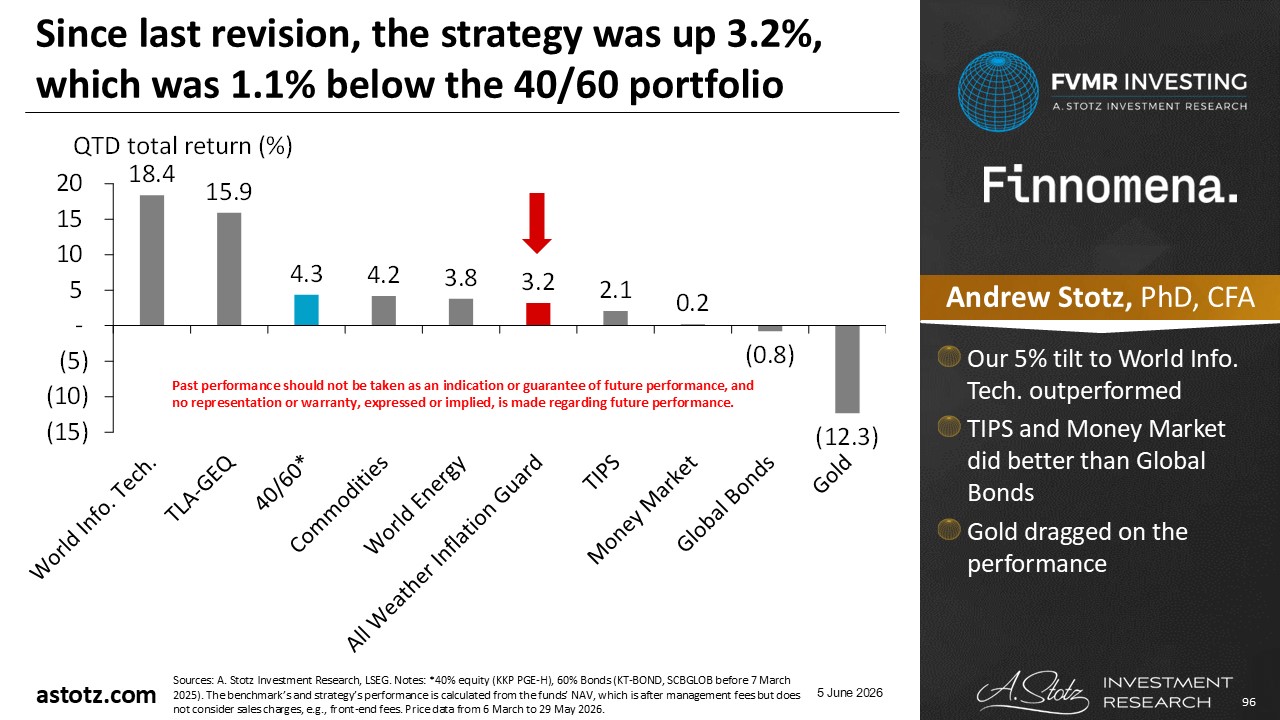
- Our 5% tilt to World Info. Tech. outperformed
- TIPS and Money Market did better than Global Bonds
- Gold dragged on the performance
The strategy added 2.4% value compared to a 40/60 portfolio in 2026YTD
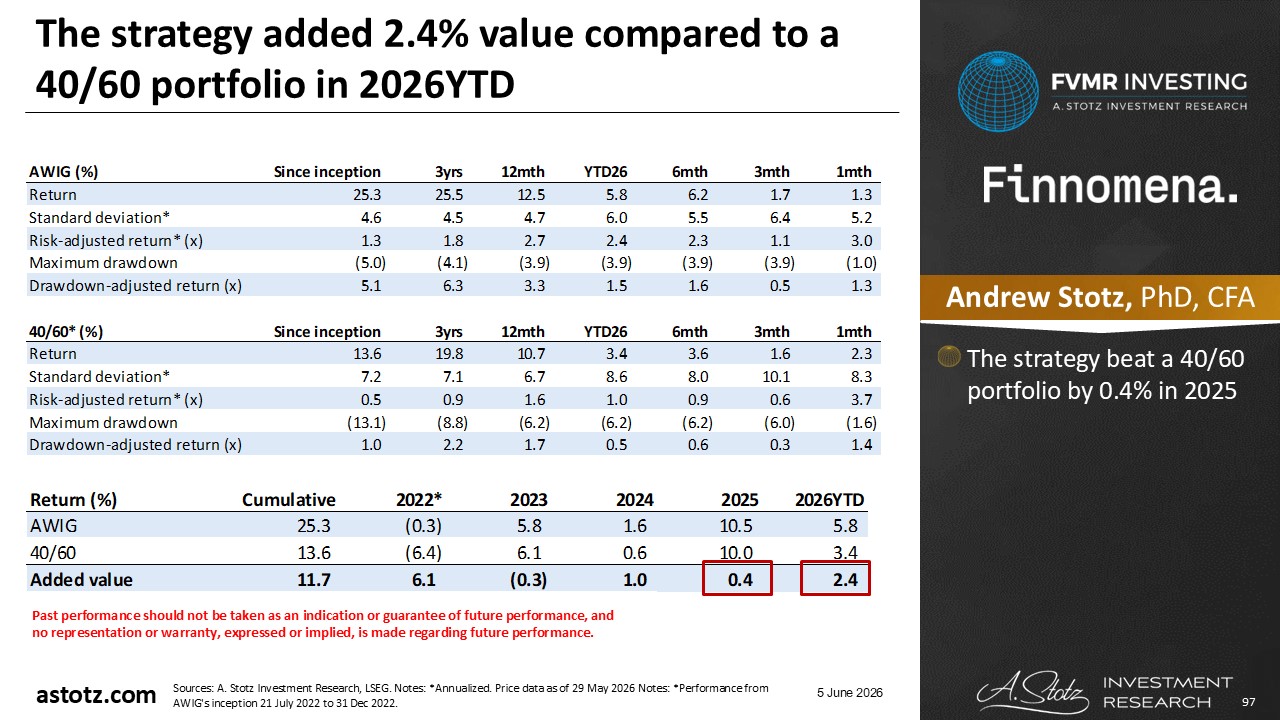
- The strategy beat a 40/60 portfolio by 0.4% in 2025
Performance review: All Weather Strategy
All Weather Strategy gained 2.6%
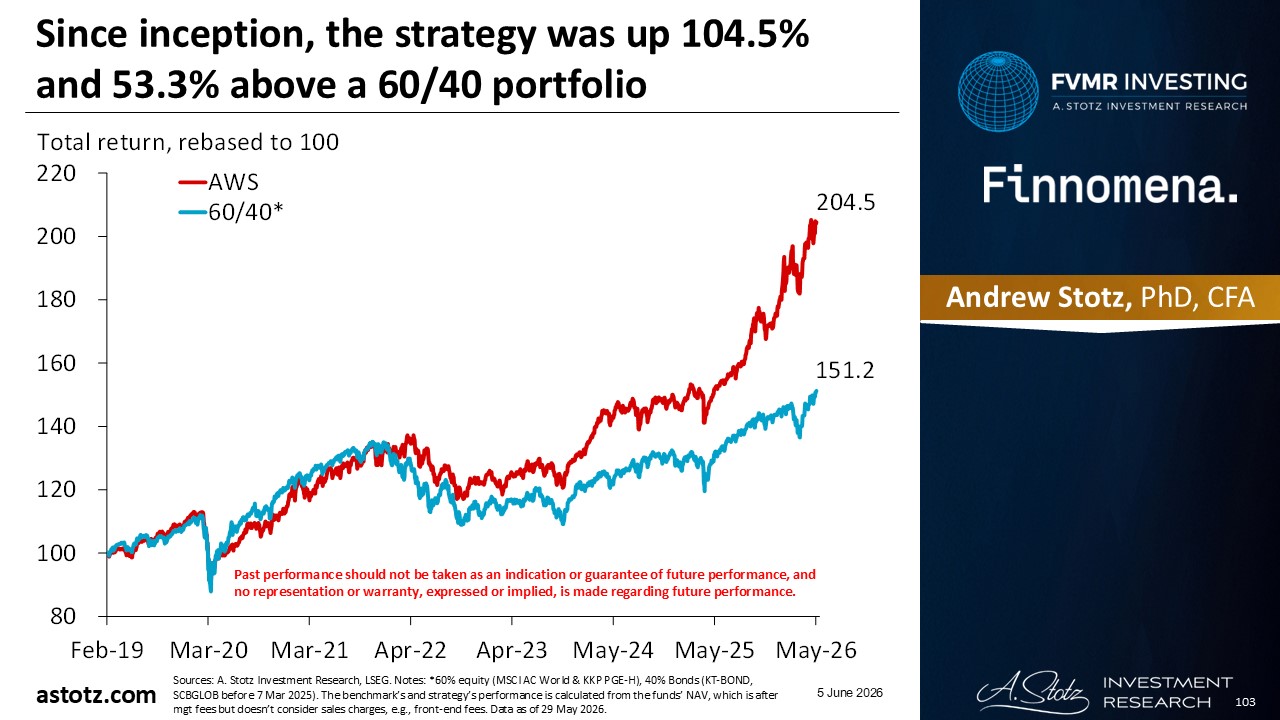
Since inception, the strategy was up 104.5% and 53.3% above a 60/40 portfolio
In May 2026, the strategy was up 2.6%, which was 0.3% below the 60/40 portfolio
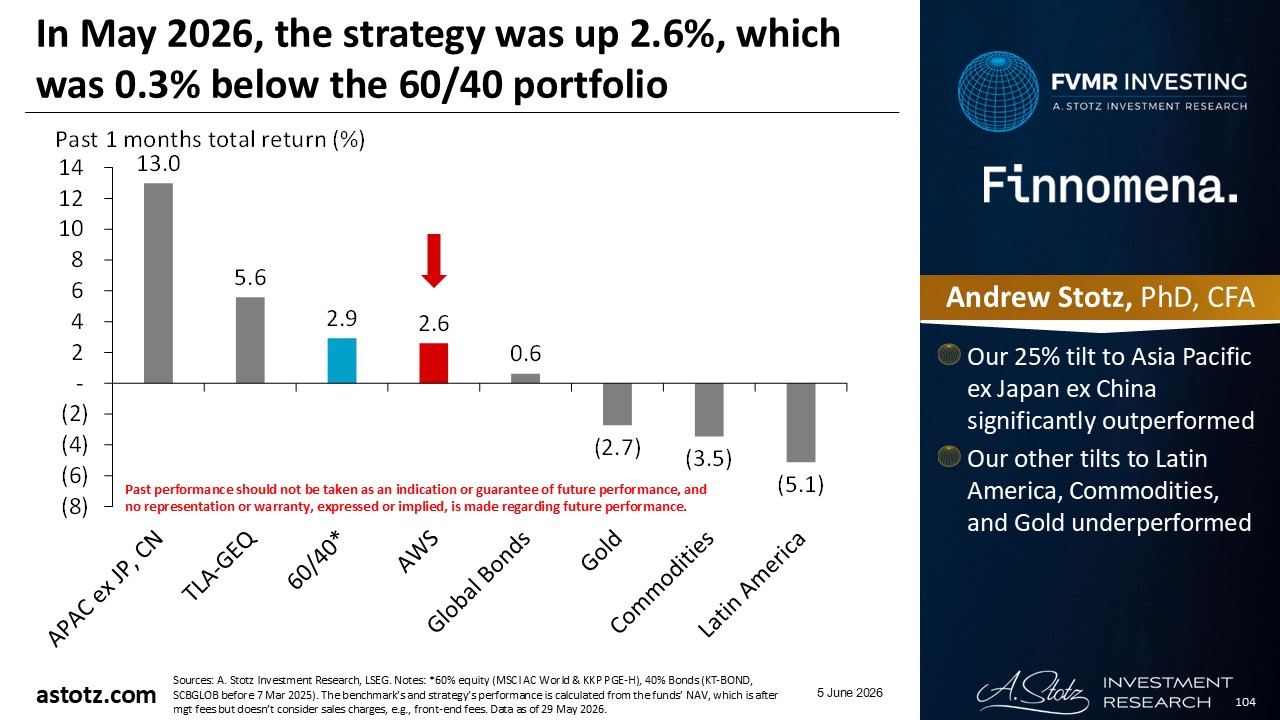
- Our 25% tilt to Asia Pacific ex Japan ex China significantly outperformed
- Our other tilts to Latin America, Commodities, and Gold underperformed
Since last revision, the strategy was up 8.7%, which was 2.3% above the 60/40 portfolio
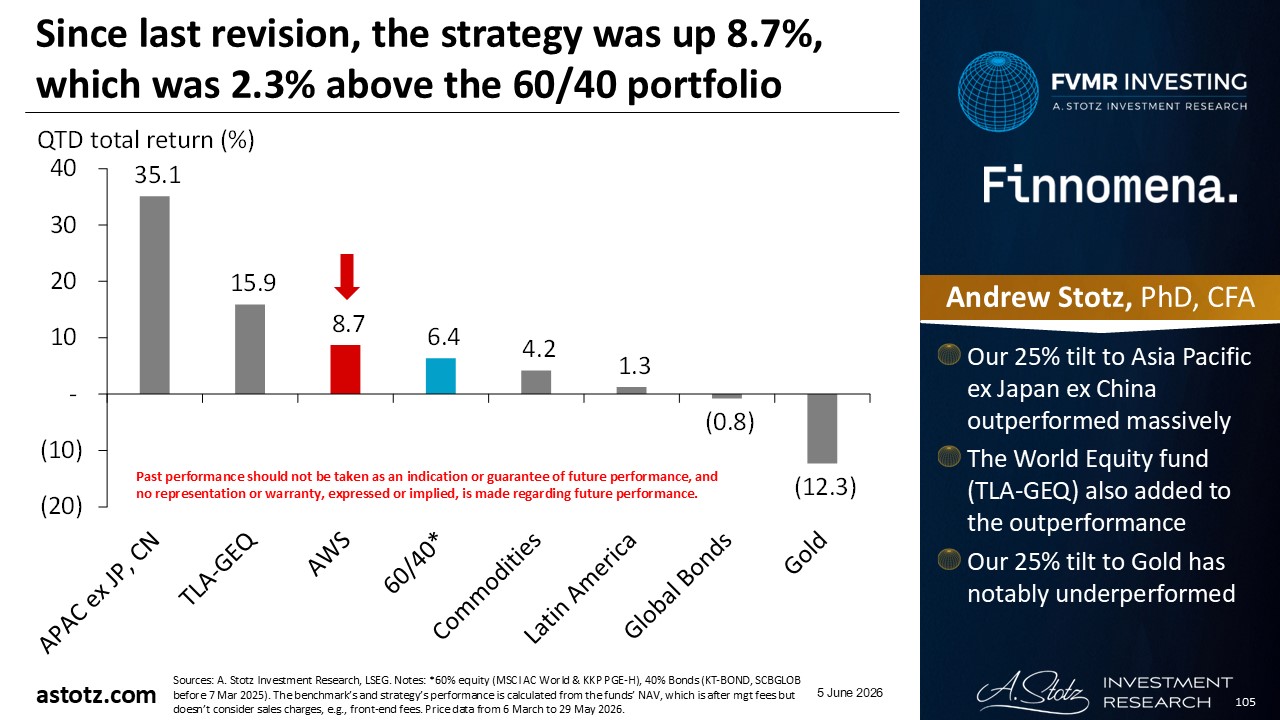
- Our 25% tilt to Asia Pacific ex Japan ex China outperformed massively
- The World Equity fund (TLA-GEQ) also added to the outperformance
- Our 25% tilt to Gold has notably underperformed
The strategy has added 11.6% value compared to a 60/40 portfolio in 2026YTD
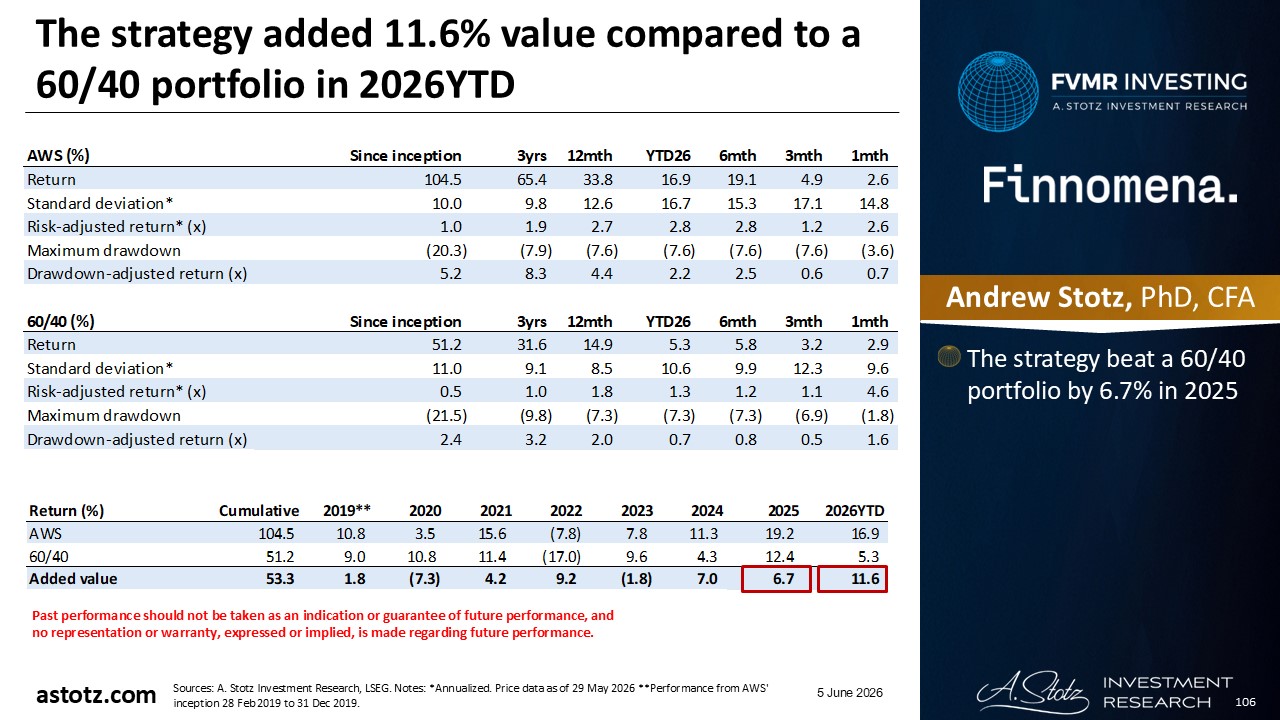
- The strategy beat a 60/40 portfolio by 6.7% in 2025
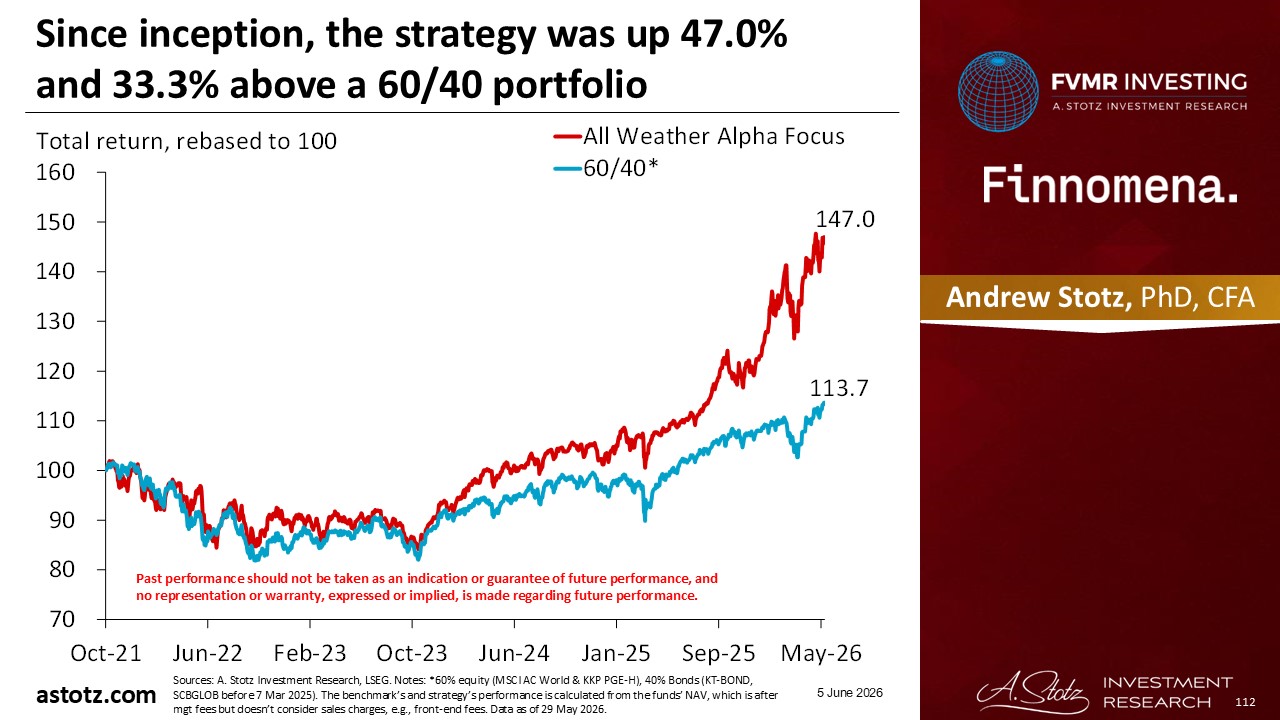
Performance review: All Weather Alpha Focus
All Weather Alpha Focus gained 3.7%
Since inception, the strategy was up 47.0% and 33.3% above a 60/40 portfolio
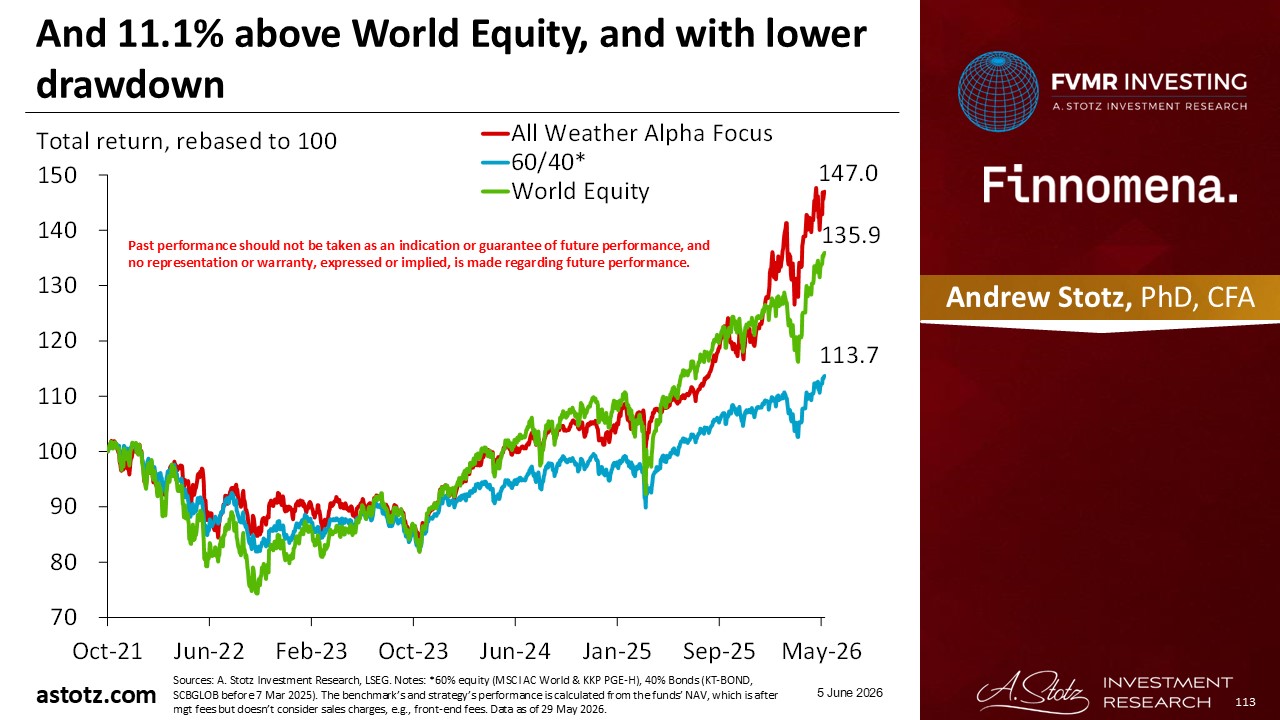
And 11.1% above World Equity, and with lower drawdown
In May 2026, the strategy was up 3.7%, which was 0.8% above the 60/40 portfolio
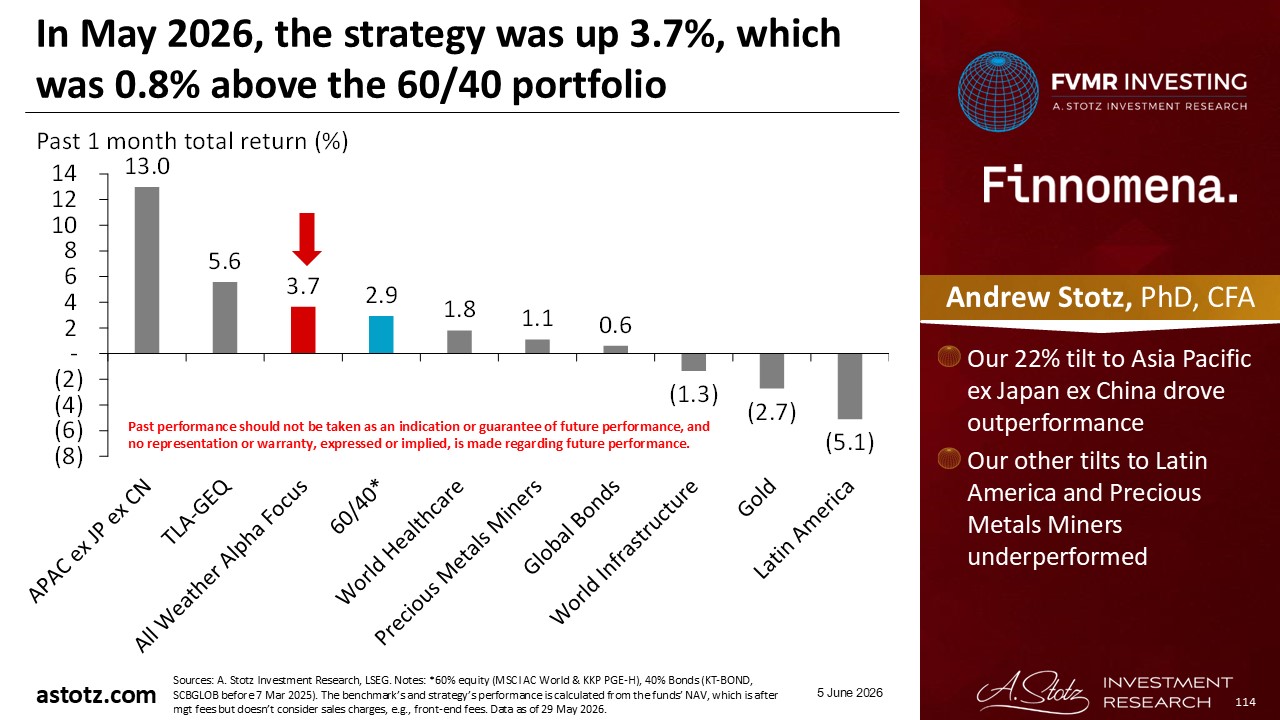
- Our 22% tilt to Asia Pacific ex Japan ex China drove outperformance
- Our other tilts to Latin America and Precious Metals Miners underperformed
Since last revision, the strategy was up 9.8%, which was 3.4% above the 60/40 portfolio
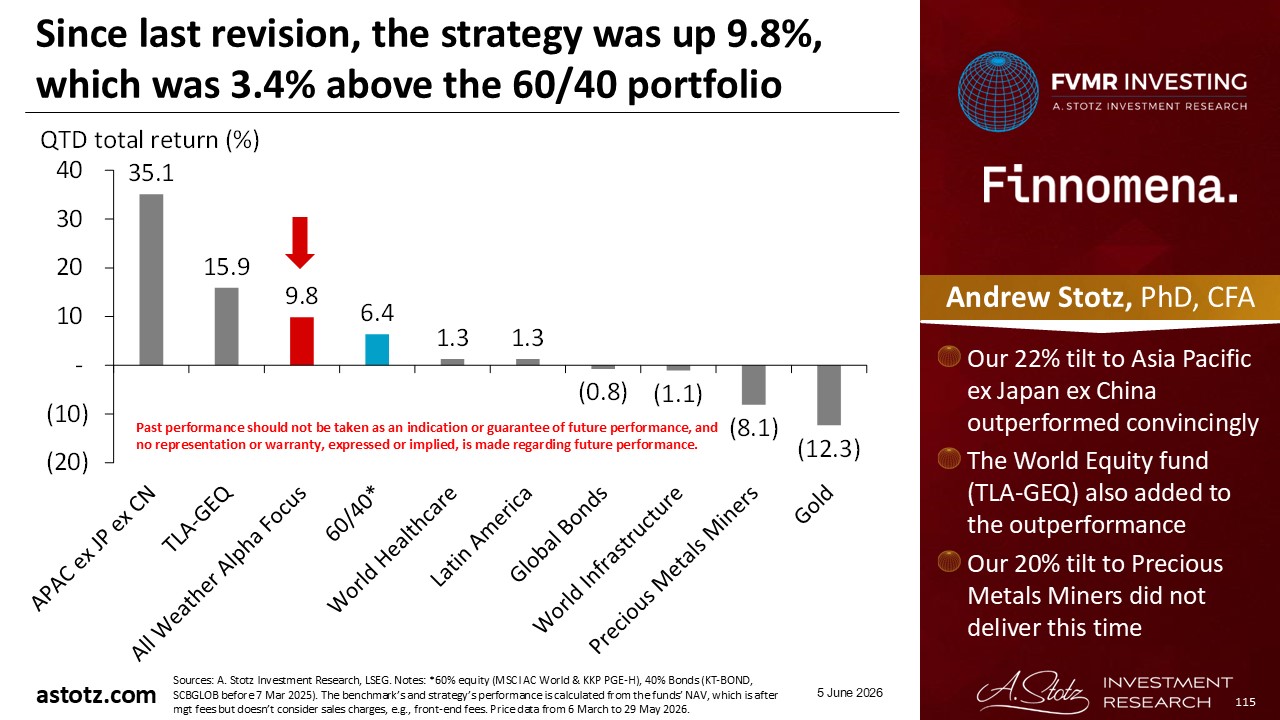
- Our 22% tilt to Asia Pacific ex Japan ex China outperformed convincingly
- The World Equity fund (TLA-GEQ) also added to the outperformance
- Our 20% tilt to Precious Metals Miners did not deliver this time
The strategy has added 14.1% value compared to a 60/40 portfolio in 2026YTD
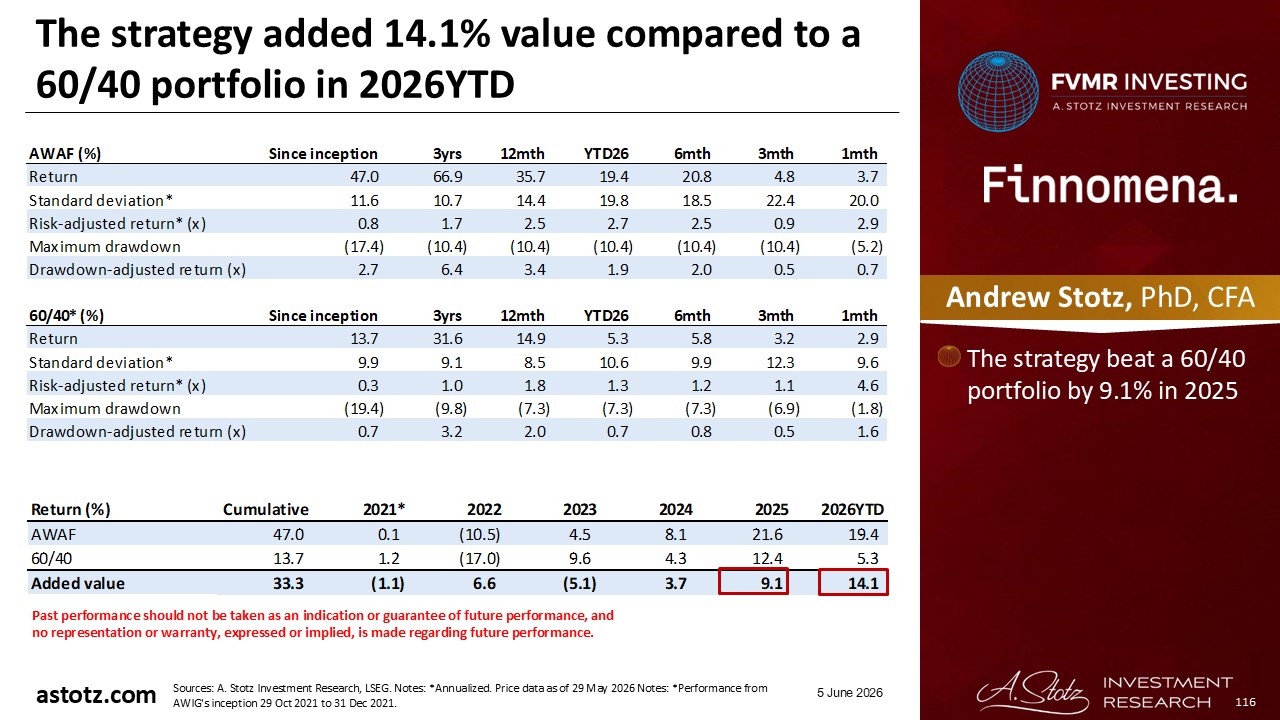
- The strategy beat a 60/40 portfolio by 9.1% in 2025
DISCLAIMER: This content is for information purposes only. It is not intended to be investment advice. Readers should not consider statements made by the author(s) as formal recommendations and should consult their financial advisor before making any investment decisions. While the information provided is believed to be accurate, it may include errors or inaccuracies. The author(s) cannot be held liable for any actions taken as a result of reading this article.