Profitable Growth is What Matters for Long-Term Value
Watch the video with Andrew Stotz or read below about how we use World Class Benchmarking to analyze a company’s financial performance.
This post is going to give you insights to the World Class Benchmarking we use to analyze a company’s financial performance at A. Stotz Investment Research. I’m going to explain the measure that I focus on which is Profitable Growth. And that’s what matters to me when I’m looking at the fundamental performance of companies.
I focus on Profitable Growth which is at the top of my financial performance triangle. You’ll come to know my world-class benchmarking measure by this triangle which we discuss later in more detail.
Executive Summary
The first thing is that I’m looking at a global universe of about 27,000 companies across 10 different sectors. The second is that I try to rank companies on their Profitable Growth measure from 1 (best) to 10 (worst) against all their sector peers of similar size. This is not a measure of one company against its immediate peer but against the whole group or sector.
What I found is that the share price performance of superior Profitable Growth companies has beaten peers. Also, companies with large improvements in Profitable Growth rank yielded outstanding share price returns.
And I’m going to show you that at the bottom of the financial performance triangle shows the strengths and weaknesses of the company and builds up to that Profitable Growth ranking.
Why Does Profitable Growth Matter?
Because a superior Profitable Growth company’s share price or valuation beats their peers. And what I’ve been able to find is that a large improvement in Profitable Growth will give larger returns relative to other companies.
Academic-Style Research: Profitable Growth
Data
Here is an academic-style study we’ve recently done and we’ll go through the details:
The data used for this study started with 19,500 companies across the world. Originally, we started with 93,500 but there were a lot of issues like warrants that we eliminated.
Then, we ended up removing financial companies and companies with a market capitalization of less than US$50 million; which left us with 23,500 non-financial companies worldwide. We removed 4,000 stocks that did not have the fundamental data needed to calculate the A. Stotz Profitable Growth metrics. This left us with about 19,500 stocks listed on different markets across the world. This data is from 1995 to 2015.
Methodology
As to the methodology of how we did this study, we grouped all companies by size within the 10 different sectors:
- Large: These are companies with either assets or sales of more than US$700 million.
- Small: These are companies with either assets or sales of less than or equal to US$130 million.
- Medium: These are companies that are in between the large and small-sized companies.
If the sales and assets for a company showed conflicting results, we let the size of the sales determine the group that the company would go into. A company that had sales of a large company but assets of a medium one were classified as large; and a company with medium sales and large assets were classified as medium.
The remaining one percent of all companies that either had large sales and small assets or small sales and large assets were classified as medium-sized companies.
Then, we calculated the two components of our A. Stotz Profitable Growth measure.
First is profitability, which is net income divided by the average assets outstanding in a business

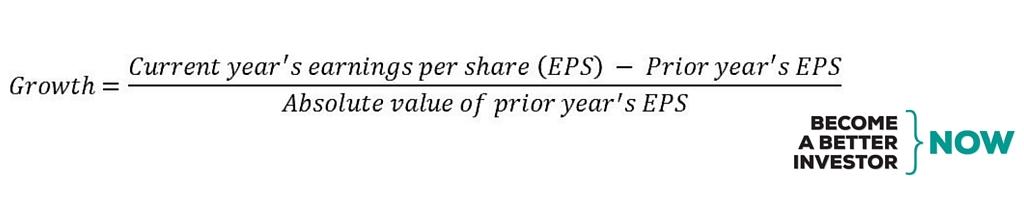
Then, there’s the growth in earnings per share, which is the current year’s EPS minus the prior year’s EPS divided by the absolute value of the prior year’s EPS.
We ranked the companies in deciles on our combined Profitable Growth score relative to all their sector peers of similar size across the world in each year from 1995 to 2015.
We then calculated the one-year-stock-price return from the prior year’s reporting date. For example, for the December 2013 results, if we assume that the company announced its financial results by March 2014, then its one-year share price return was from March 2013 to March 2014.
Then we calculated the simple average price return for each Profitable Growth decile and the compound annual price return during the March 1995 to March 2015 period. To eliminate outliers, we excluded 1% of the observations, which were stocks that had a price change of more than 500% or less than -85% in any one year.
We then repeated this process for each size group—large, medium, and small; and looked at the results separately. After excluding all companies that didn’t have year-end in December and adjusting for outliers, we ended up with:
- 3,600 large companies
- 4,400 medium companies
- 4,000 small companies
- Total of 12,000 companies
Results
We found that for large companies, the superior Profitable Growth companies beat their peers; in other words, the higher deciles yielded higher returns versus the lower deciles.
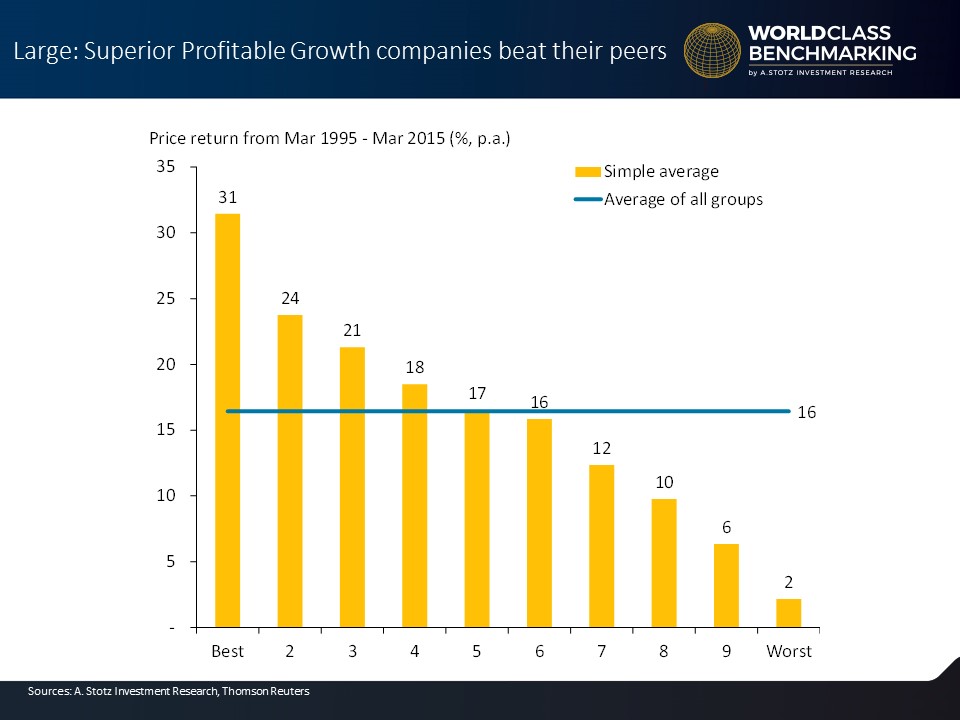
Over the time period studied, even the worst decile showed an average annual return that was positive. But the decile with the best Profitable Growth returned was 15x higher than the worst; or 31% average annual price return versus only 2% for the worst.
Now, if we look at medium-sized companies, we found roughly the same thing.
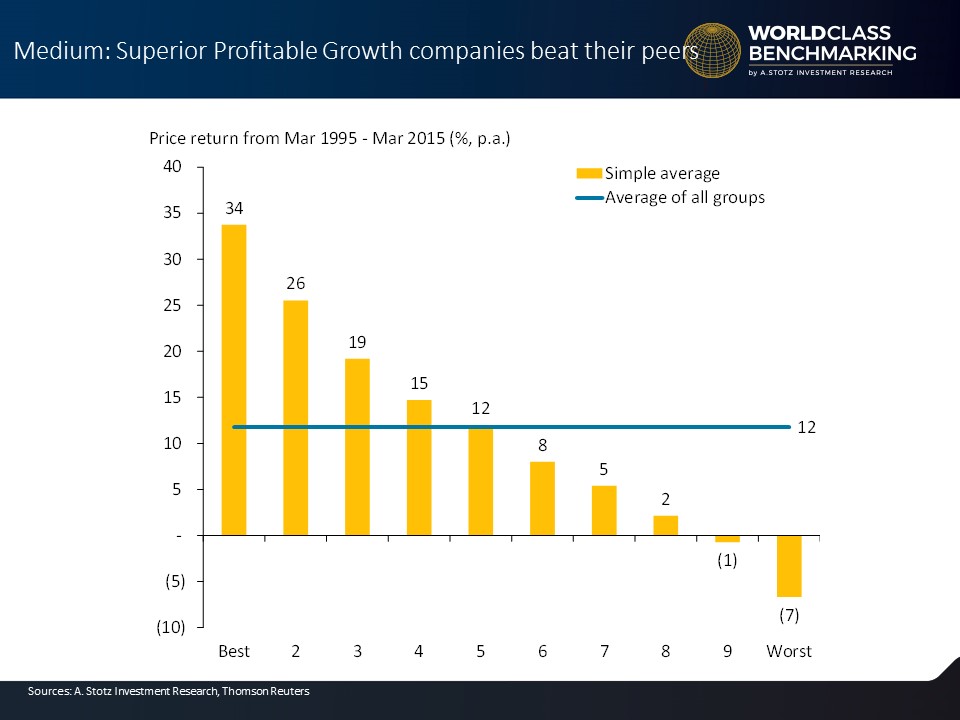
The higher ranked deciles yielded higher returns. We also saw that for medium-sized companies, the difference between the best and worst were even more significant than for the large companies. The two worst deciles showed a negative average annual return.
And then, if we look at small companies, we find that, again, the higher ranked deciles yielded higher returns.
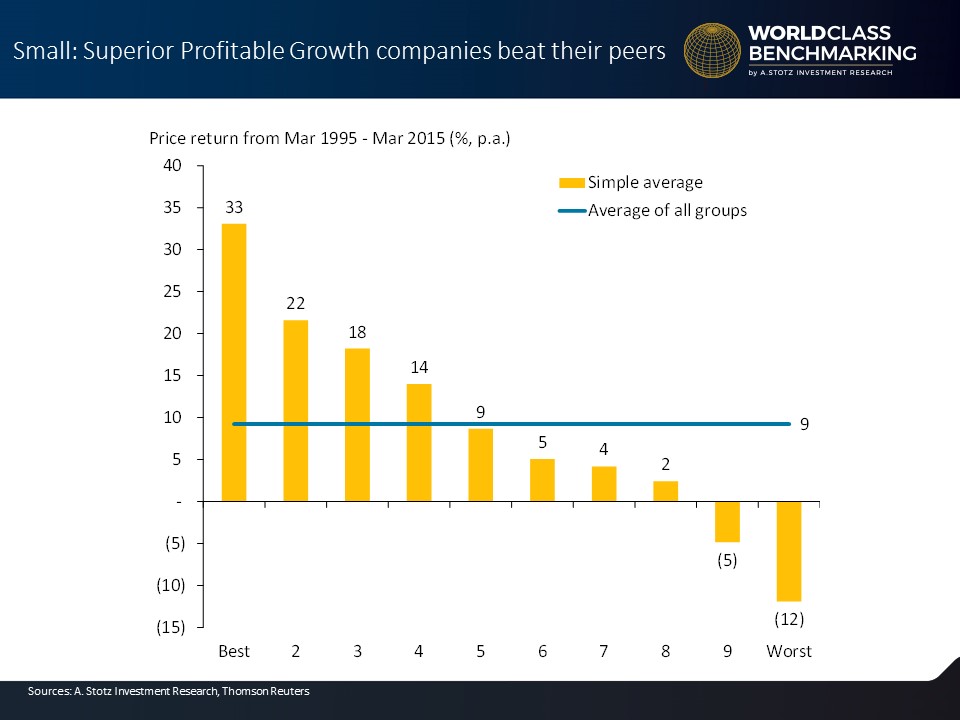
We also see that the Profitable Growth rank shows a clear relationship with share price and a high rank means a high share price; and a higher Profitable Growth rank ultimately means a higher value of the business. This holds true for large-, medium-, and small-sized companies; though it’s more extreme in the case of small- and medium-sized companies.
Methodology (cont.)
For Part two of this methodology, we analyzed the share price performance of the companies that changed their Profitable Growth rankings in each size group. We calculated the change in decile ranking from the prior year in each group. For example, if the company was ranked in the 3rd decile this year versus the 4th decile last year, the company would have improved by one step.
Then, we grouped the companies that showed no change in decile rankings as the starting point. After that, we grouped every company that showed an incremental one-, two-, or three-step improvement into another group. From this, we ended up with seven groups, each containing a different number of companies.
Then, we calculated the simple average price change of each group for each year, assuming that we started to invest in each group every year in March, from March 1995 to March 2015. Then, we compounded the annual returns for each group.
Results
What did we find? We found that large companies with large improvements in Profitable Growth rank yielded outstanding returns.
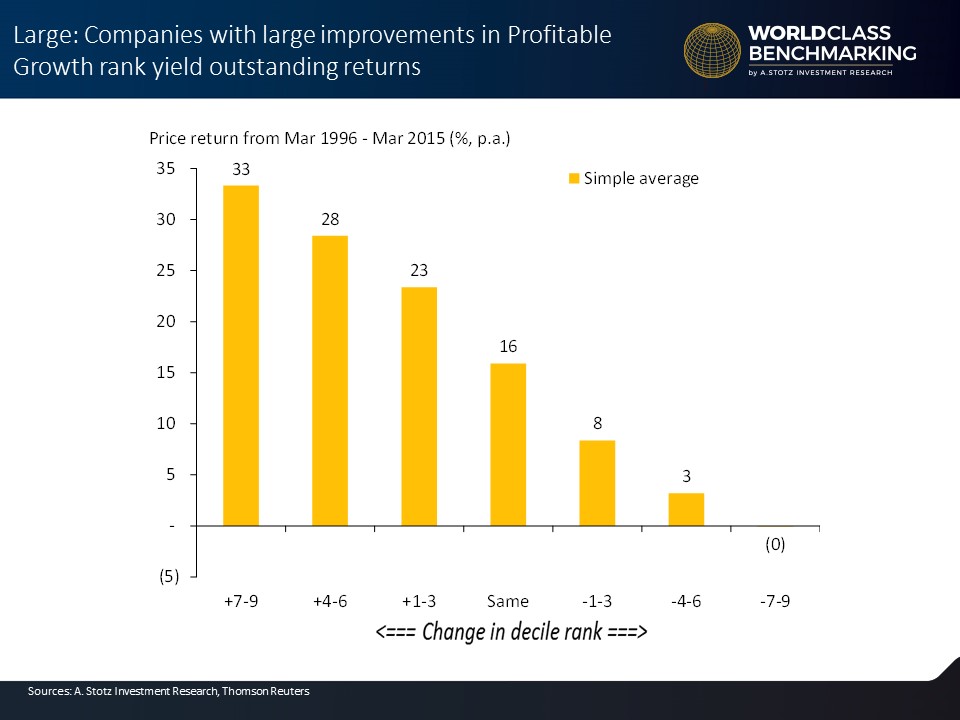
We saw that the Profitable Growth group that improved by 7 to 9 steps, returned 33% per annum; which is more than double the return compared to the group that showed no improvement. The Profitable Growth group that fell 7 to 9 steps in decile rank displayed a slightly negative price performance.
If we look at medium-sized companies, what we find is that it looks similar. But the Profitable Growth groups that improved by 4 to 9 steps returned 31%. In other words, even if a company made less of an improvement but still made a good improvement, they would get equally ranked by the market.
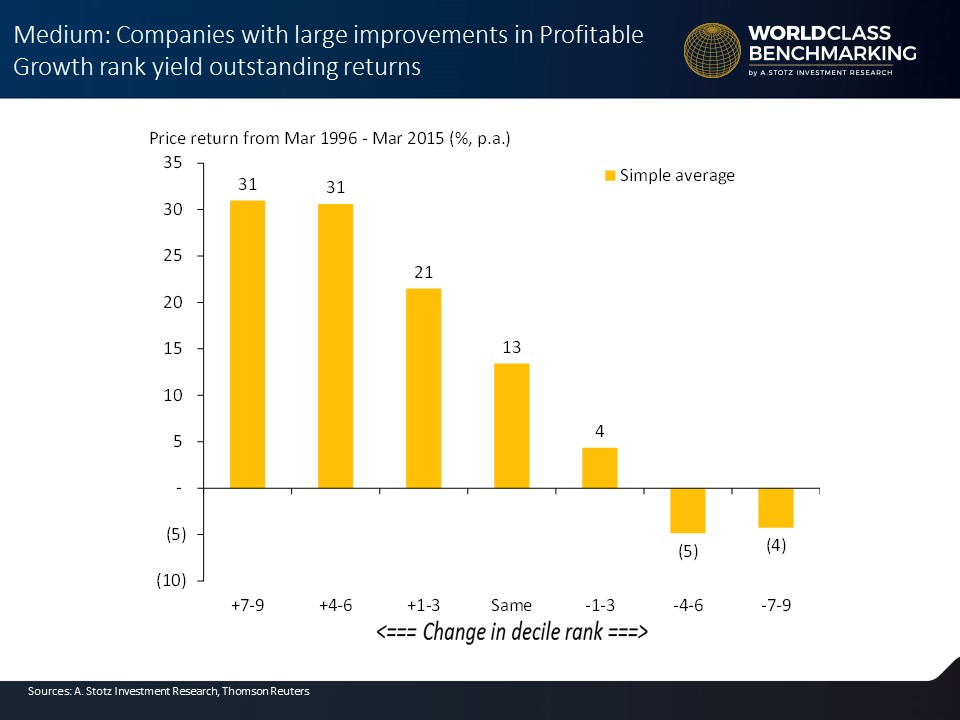
The Profitable Growth groups that fell 4 to 9 steps in decile rank displayed a negative price performance losing, on average, 4% to 5%. The market is less discerning; meaning, strong improvements almost always equal strong share price performance and vice-versa.
Finally, with small companies, the group that improved 4 to 6 steps returned more than the group that improved 7 to 9 steps.
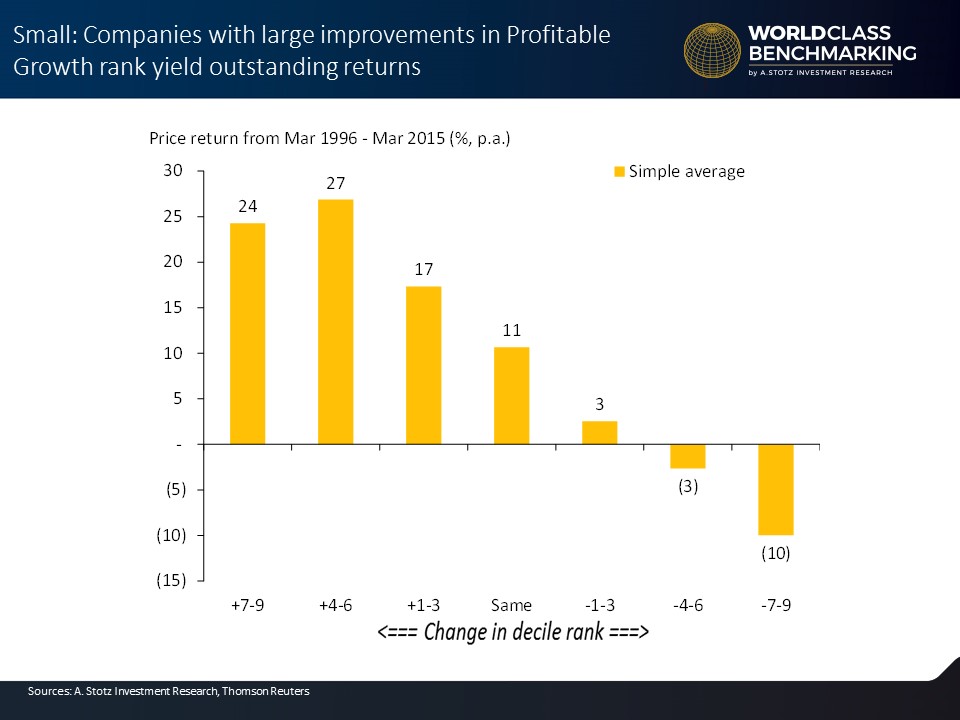
It seemed like the market was more skeptical to extreme improvements for small companies. The market rewards improvements in Profitable Growth; and this holds true for large, medium, and small companies.
Key Learnings: Why Profitable Growth Matters
First of all, using results from our research looking at 12,000 companies across the world, we showed that share price performance of superior Profitable Growth companies beat their peers. Companies with large improvements in Profitable Growth rank yield outstanding share price returns. This holds true for large, medium, and small companies—for all three groups.
Now, let’s talk about classifying the peer group. First, we ask the question, what is the size of the business? Then, we ask, what sector does the company operate in?
Classifying the Peer Group
What is the Size?
Size does matter because small companies tend to grow faster than large companies. First, we group the companies into one of the following three size categories: small, medium, or large.
- Large firms, as I’ve mentioned before, have assets or revenue of more than US$700 million.
- Small firms have assets or revenue of less than US$130 million.
- Medium firms have assets or revenue between the large and small firms.
What Sector Does the Company Operate In?
There are ten major sectors in the world. No two companies are alike but some are more alike than others. So, we use The Global Industry Classification Standard (GICS®) developed by MSCI & Standard & Poor’s. Currently, there are 10 sectors and 24 industry groups.
Now, we rank the companies within one of the 10 major sectors. We have to ask what sector the company operates in. Below you find the 10 sectors as well as a company in each sector that you hopefully have heard about before (if not, Google is your friend J):
- Consumer Discretionary – Ford
- Consumer Staples – Wal-Mart
- Energy – Exxon Mobil
- Health Care – Johnson & Johnson
- Industrials – General Electric
- Information Technology – Google
- Materials – Monsanto
- Real Estate – Simon Property Group
- Telecom – AT&T
- Utilities – Duke Energy
Key Learnings: Classifying the Peer Group
First, we classify the business based on its size, meaning, small, medium, or large. A large company should not be compared against a small company and vice versa. We then classify the company into a global sector. A consumer company should not be compared against an energy company, for example.
How to Read the Triangle
The Top of the Triangle is What Matters
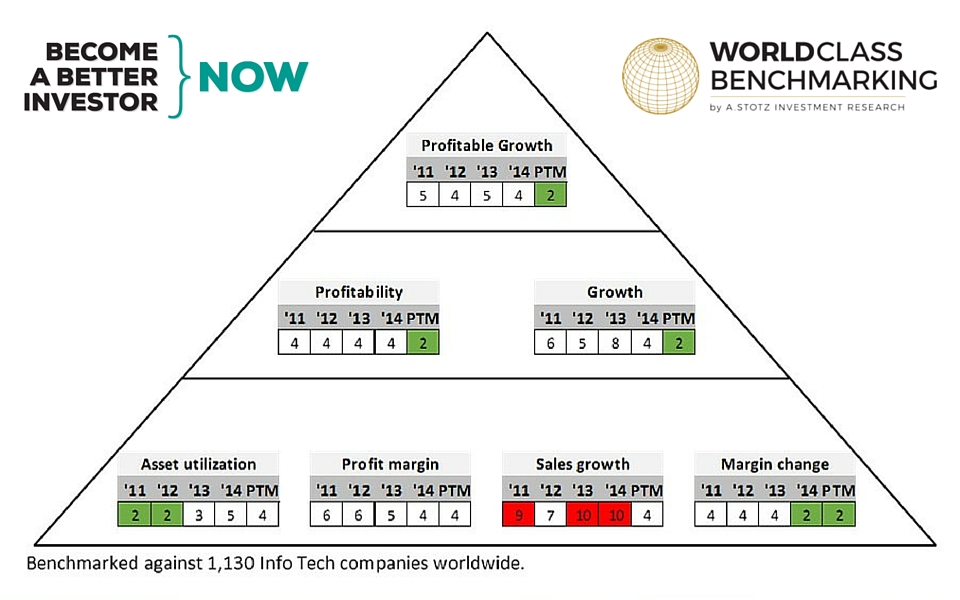
Now let’s talk about how to read the triangle. The top of the financial performance triangle (Profitable Growth) is what matters. The results at the top of the triangle are explained by the results below. Level two and three of the triangle explain what is driving the Profitable Growth.
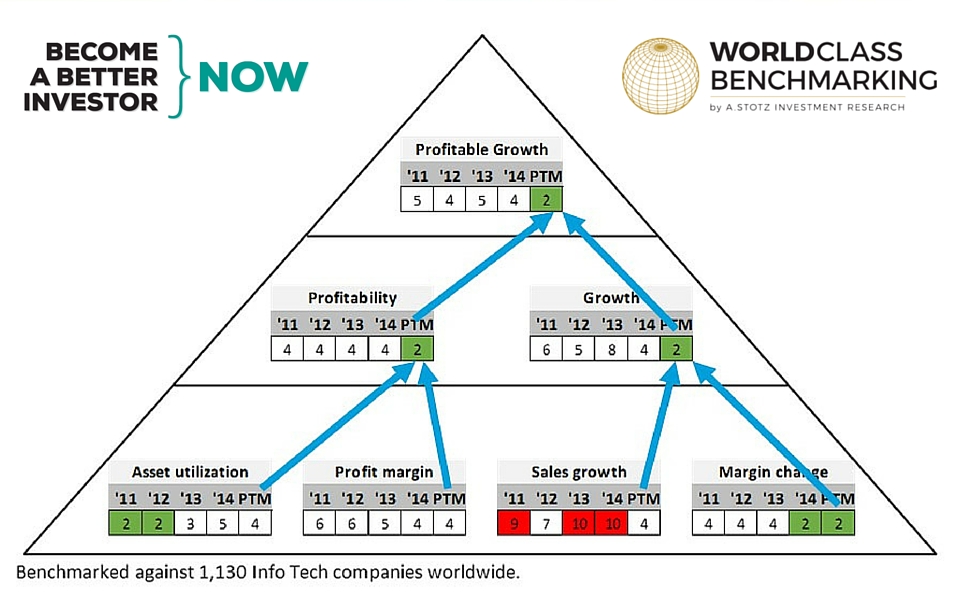
Let’s talk about the top of the triangle and basically remember that how we do this is that we look at the ranking of a company. In this case, in the year 2011, we ranked companies from best to worst.
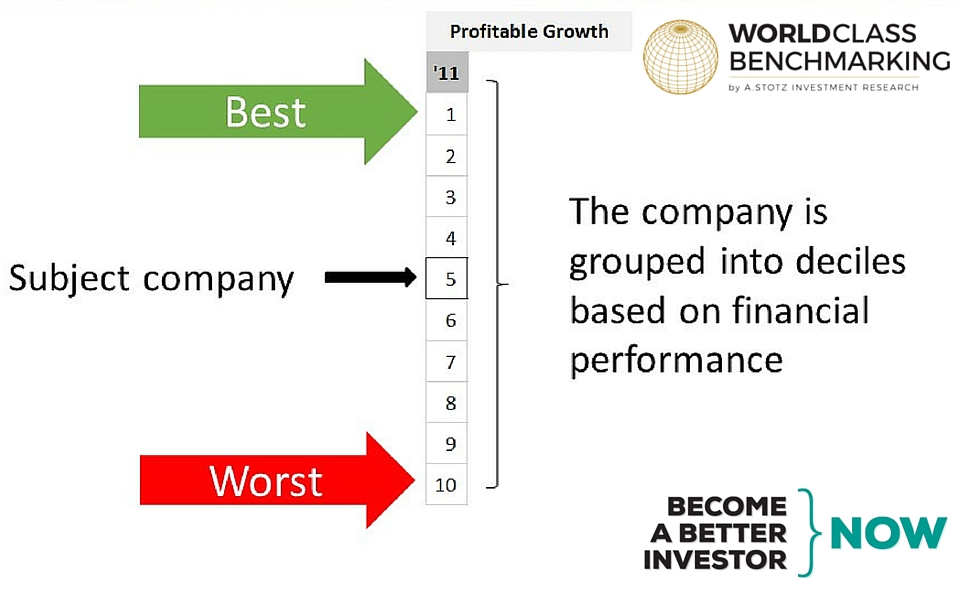
As an example, let’s just say that this is a subject company that’s ranked at number five. All the companies in that industry are grouped into deciles based on their financial performance or their Profitable Growth score. We look at this and we actually see that we do more than look at 1 year. We are looking at 5 years and we do PTM (past 12 months) ranking from best to worst. In this case, the company was ranked in the 4
Take a look at the chart below and you can see that we do more than look at 1 year. We are looking at 5 periods; 4 years and PTM (past 12 months) ranking from best to worst. In this case, the company was ranked in the 4th decile in 2014, and then it improved in the past 12 months to 2nd.
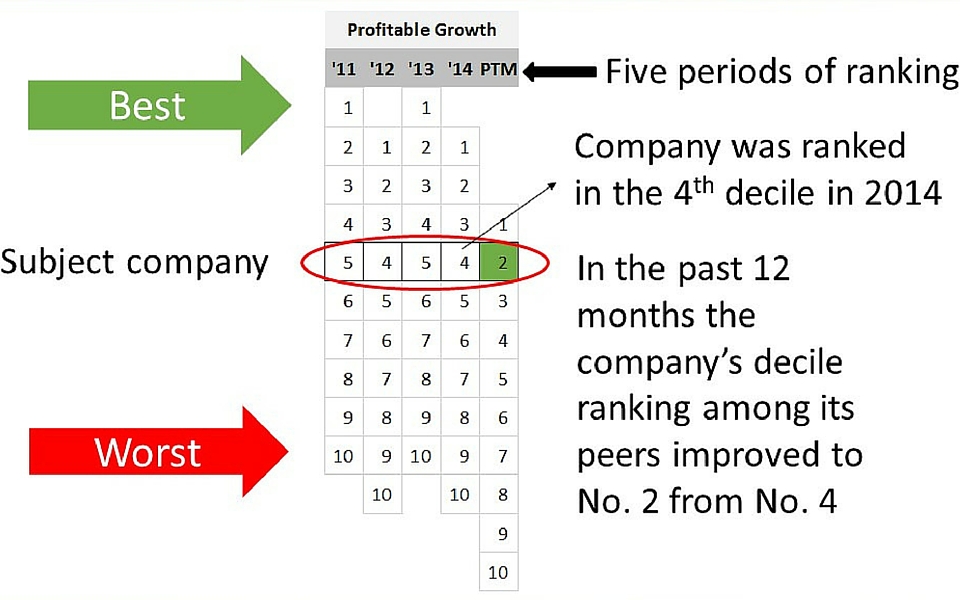
So we can see that this company went from a 2011 ranking of 5 to a 2012 ranking of 4, which was an improvement. It went back down in 2013, then it improved in 2014 and 2015; or for the past 12 months, it improved to a ranking of 2.
We then put that company’s 1 to 10 rank into the triangle.
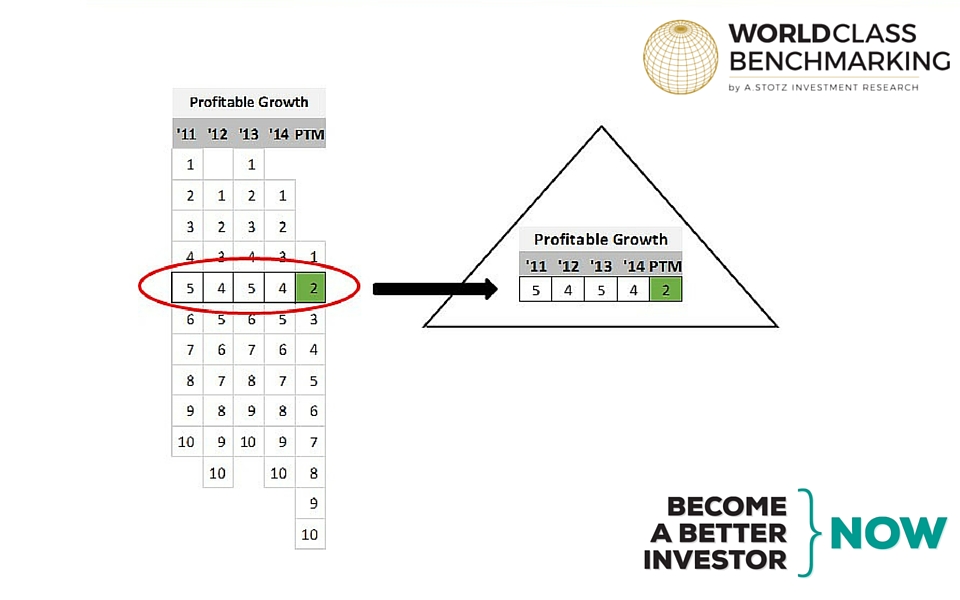
The Top of the Triangle: Profitable Growth
Now, we get to the top of the triangle which is Profitable Growth.

Profitable Growth comes from a combination of the company’s score on profitability and growth. What we want to think about is that this Profitable Growth drives truly sustainable long-run value in the business. Reduced asset driven earnings growth is great because this decreases a need for new capital injections.
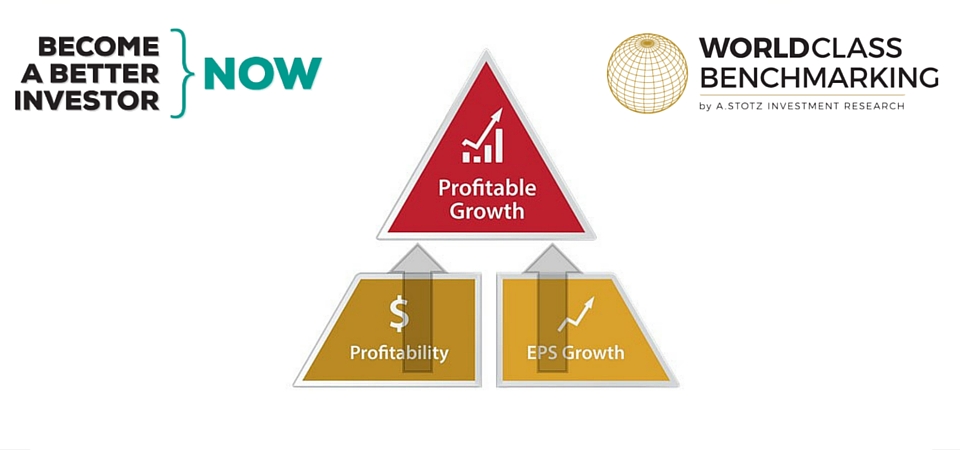
The First Driver of Profitable Growth: Profitability
If we look at profitability, it means generating more profit from the assets in place. It is profit divided by assets or return on assets. Getting more out of assets means the company needs less capital. But, beware! Very high profitability with no growth is not sustainable.
The Second Driver of Profitable Growth: Growth
EPS growth is the annual percent change in profit per share. This shows that customers want the company’s product and that it can be produced profitably. Again, beware! High growth but low profitability is often a waste of money.
The Drivers of Profitability and Growth
Now, we can see the triangle with one more layer below it. We can see that the profitability drives the profitable portion of the Profitable Growth; and the EPS growth figure drives the growth component of Profitable Growth.
The results at the top of the triangle are explained by the results below; each measure is explained by the two measures below it. We can see that asset utilization and profit margin produce our calculation of profitability and sales growth and margin change produces our EPS growth. And it is our profitability and our EPS growth that ultimately produce the Profitable Growth.
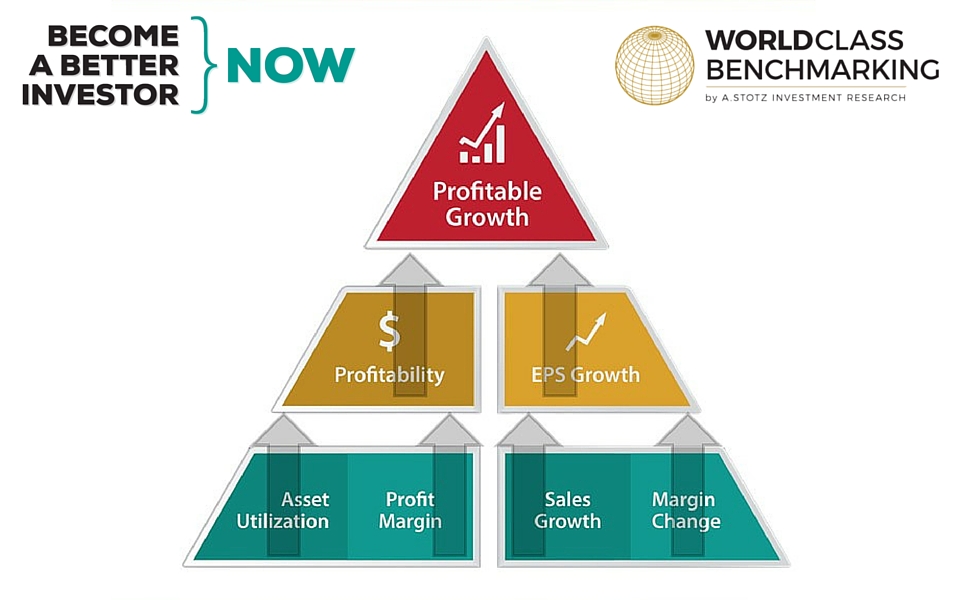
The Two Drivers of Profitability
Asset Utilization
Let’s start with asset utilization; that’s sales divided by assets. You want to get more revenue from the assets you have in place; and that’s one way to increase profitability. Careful asset growth preserves capital. But, beware! Too tight asset growth means that sales may be hampered.
Profit Margin
The next area, profit margin, is profit divided by sales.
A strong profit margin shows that the products that customers want are able to be delivered profitably. This is one measure of the strength of the management team. But, again, beware! Too tight cost control can constrict growth.
The Two Drivers of Growth
Sales Growth
First is sales growth which is the annual change in sales. This is the part of EPS growth that is externally driven. It’s essential to grow the business. No sales growth means no customer demand. So we must have it. But growth without profit ends painfully.
Margin Change
Let’s look at the next measure which is margin change, that’s annual change in net profit margin. If the margin was 10% and it went down to 9%, the change would be 1%. Margin improvement comes from the management team’s focused effort. It means the company is getting more profit from every sale. But, again, beware! Too high prices or low costs could hurt sales growth.
Now, we go back and look at our triangle and we can see that asset utilization and profit margin drive the Profitable Growth ranking; and sales growth and margin change drive the growth ranking. The profitability and the growth ranking drive the Profitable Growth ranking and score.
Key Learnings: How to Read the Triangle
- The company is ranked against peers on six different measures, four of them on the bottom of the triangle.
- Asset utilization is the revenue generated from assets in place.
- Profit margin shows how good the company is at cost control.
- Sales growth proves that customers want the product.
- A rising profit margin is an internal driver of EPS growth.
- Level two and three explain what is driving Profitable Growth.
Conclusion: World Class Benchmarking
With World Class Benchmarking we use a global universe of 27,000 companies in 10 sectors. We rank them on Profitable Growth score from 1 (best) to 10 (worst) against all sector peers of similar sizes.
We have found that the share price performance of superior Profitable Growth companies beat their peers. Companies with large improvements in Profitable Growth rank yield outstanding share price returns.
Even if a company doesn’t rank high, the bottom of the triangle shows the strengths and weaknesses of the company. Improvements or negative trends in the lower levels of the triangle will sooner or later affect what really matters; the top of the triangle—Profitable Growth.
When #benchmarking a company’s #financial performance, what do you prefer to benchmark it against?
(RT=more votes)
— Alexander Wetterling (@BkkBanker) June 16, 2016
What do you think about World Class Benchmarking as a tool to analyze a company’s financial performance? Do you have any questions or comments about it? Would you like to see the Profitable Growth rank of the stocks in your portfolio?
We’d love to hear from you in a comment below.
Feel free to share this article with your friends.
DISCLAIMER: This content is for information purposes only. It is not intended to be investment advice. Readers should not consider statements made by the author(s) as formal recommendations and should consult their financial advisor before making any investment decisions. While the information provided is believed to be accurate, it may include errors or inaccuracies. The author(s) cannot be held liable for any actions taken as a result of reading this article.