ISMS 28: Stocks for the Long Run
The post was originally published here.
Listen on
Apple | Google | Spotify | YouTube | Other
What long-term return do you expect for US stocks?
Today, Andrew is talking about a book that has landed on his desk; Stocks for the Long Run: The Definitive Guide to Financial Market Returns & Long-Term Investment Strategies.
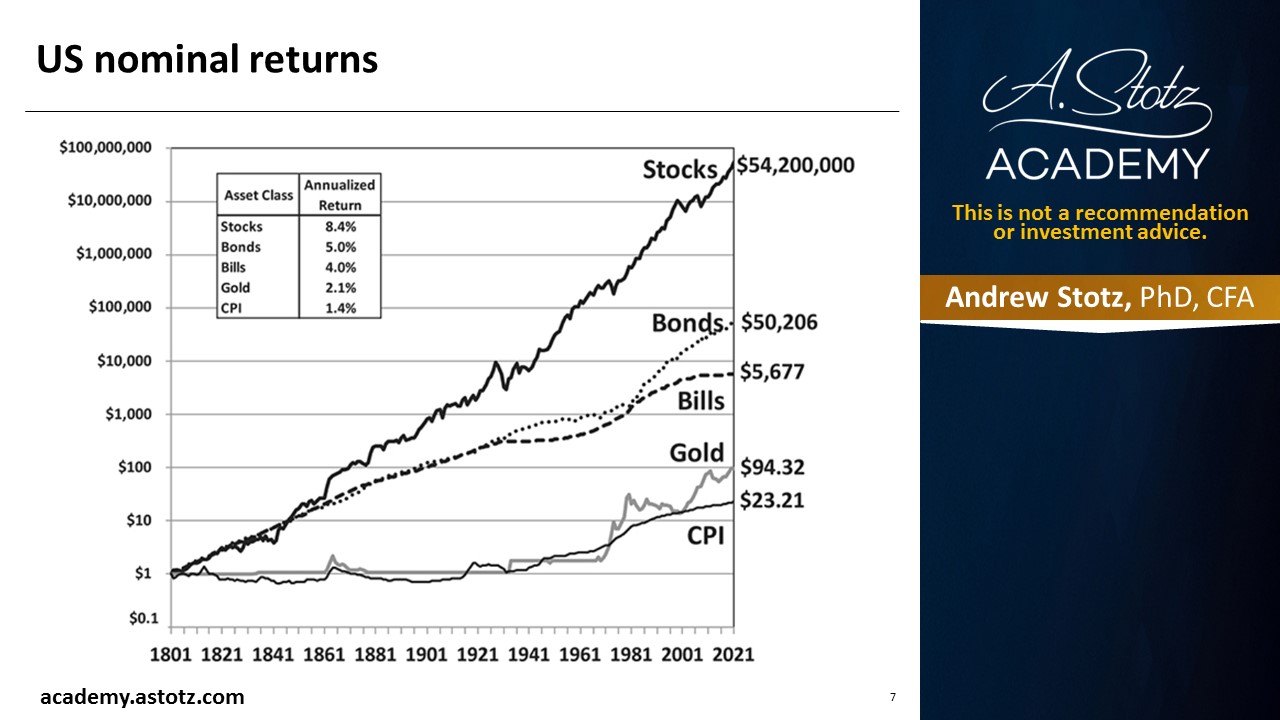
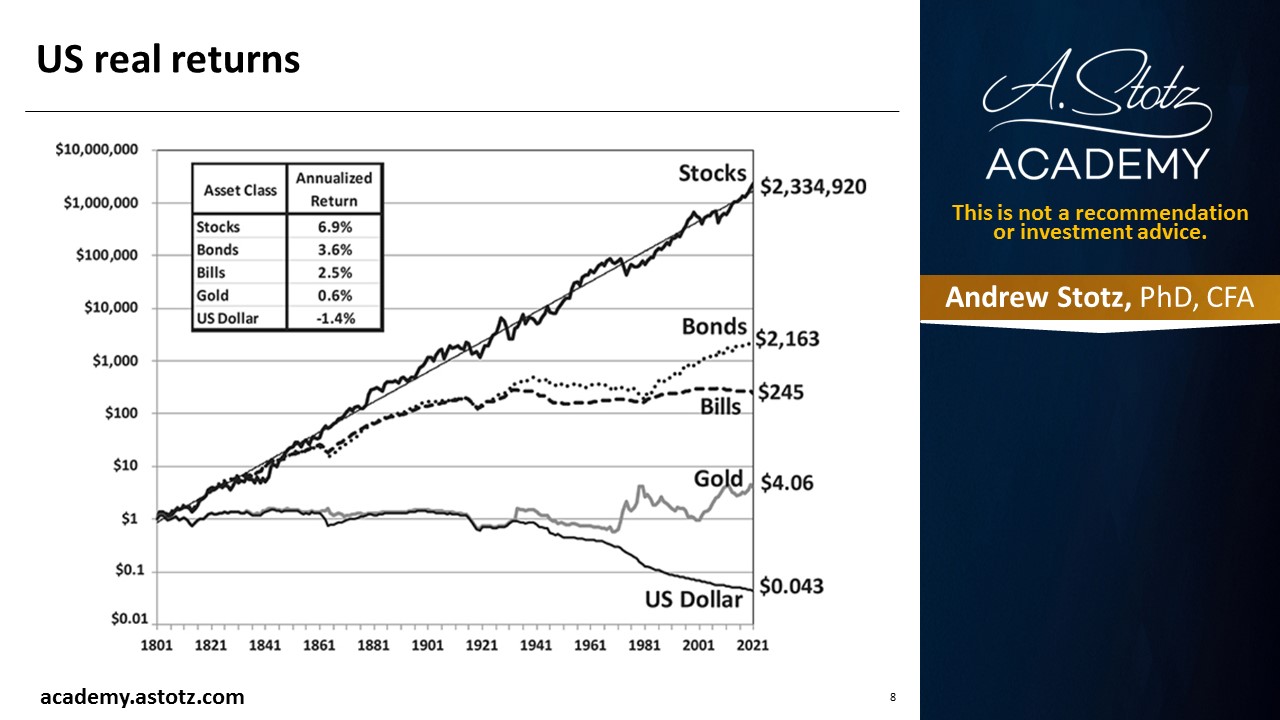
In his book, Siegel tells us to expect a 5% long-term real US stock market return. One of the first charts that he shares in the book shows the US nominal returns.
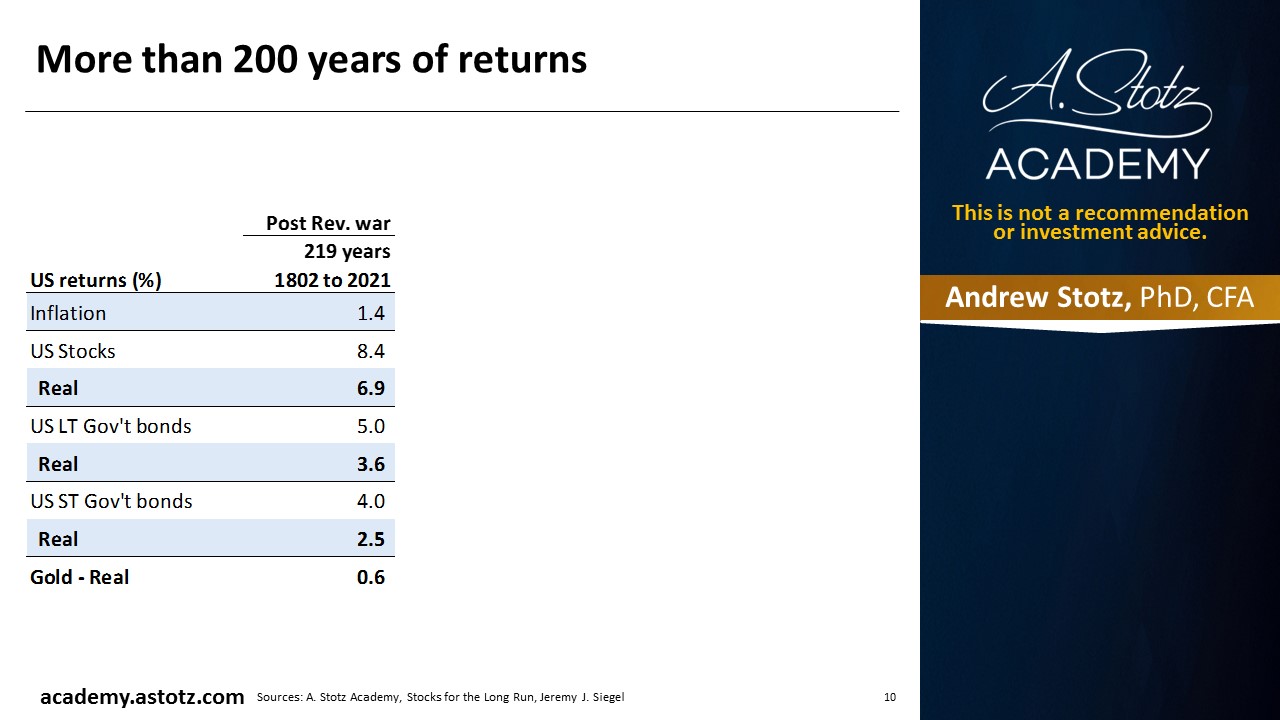
US nominal and real returns from 1801 to 2021
If you had invested $1 in the US stock market in 1801 and held that until 2021, that $1 would have been worth $54 million, an 8.4% return. That’s the nominal return. Once you take away the impact of inflation, the return goes down to 6.9%. The $1 would hence have grown to $2.3 million. This is known as the real return.
To give you an idea of this real return, if you had invested the $1 in long-term government bonds, you would have ended up not with $2,000. If you had invested in US government bills, meaning short-term interest rates, you would have gotten $245.
If you had invested in gold, you’d have only $4 of real return. Gold, in fact, is not and never has really been a great investment vehicle over the long term though it helps during periods of shocks.
Over that period, inflation was about 1.4%. Stocks had an average real return of 6.9%, long-term government bonds 3.6%, short-term government bonds 2.5%, and gold 0.6% for 220 years.
US nominal and real returns from 1926 to 2021
Let’s shorten that period and start after World War I, 95 years from 1926 to 2021. During this period, inflation was 2.9%. Real returns on stocks were 7.1%, about equal to what it was over the 200 years. The US government’s long-term bonds yielded 5.6% nominally. But because of inflation, you only got half of that at about 2.6% real return. The US short-term government bonds yielded 3.3%, but the real return was 0.4%, close to zero. Gold over this period yielded a 1.8% average annual return.
Inflation rose to 2.9% in the 95 years from 1.4% in the 200 years. That higher inflation, though, didn’t really impact the stock market.
US nominal and real returns from 1946 to 2021
If we look at the last 75 years, from 1946 to 2021 (post-World War II), when the dollar reigned supreme. Inflation was 3.7%. The real stock market return was 7.3%. So again, not much change in real stock market returns. Real long-term government bond return was 2%, 0.2% return for short-term government bonds, and 1.6% real return for gold.
US nominal and real returns from 2000 to 2021
Looking at the post-dot-com period (2000 to 2021), inflation was lower at about 2.3%. The Fed has kept interest rates at zero for the last 15 years. During this period, the US stock market returns were at 5.2%, and long-term government bond return was at 4.6%. So stocks and long-term government bonds almost had the same real return. That’s because interest rates were in a long-term downtrend. When interest rates fall, bond prices rise, so you’re outperforming your bond portfolio. 20 years of falling interest rates mean 20 years of solid performance of your bond portfolio, particularly your long-term bond portfolio.
During these 21 years, short-term US government bonds had a nominal return of 1.5% and a real return of -0.8%. Because the Fed kept the interest rates down so low, they dropped interest rates to zero and kept it there. Therefore, there was only a small period where you got outperformance in the short-term government bonds, but they quickly repriced to zero.
In the 21 years, with interest rates going down so low, we had a lot of stability, giving gold a fantastic performance. Its real return was 6.3%.
Click here to get the PDF with all charts and graphs
Andrew’s takeaways
Looking at this analysis, stocks were the only asset class producing significant performance. This is why it’s called stocks for the long run because stocks make way more than bonds and gold.
Siegel says over the long term, an investor has paid about 15 times PE for about six to 7% after inflation stock market return. In the future, we should expect to pay about 20 times PE for about 5% after inflation return.
In Siegel’s Stocks for the Long Run, he tells us to expect a 5% long-term real US stock market return
I became a finance teacher in Thailand in 1992

Then started as a financial analyst in 1993

Siegel’s book came out in 1994 and was one of the best references available at the time
US nominal returns
US real returns
More than 200 years of returns
95 years of returns
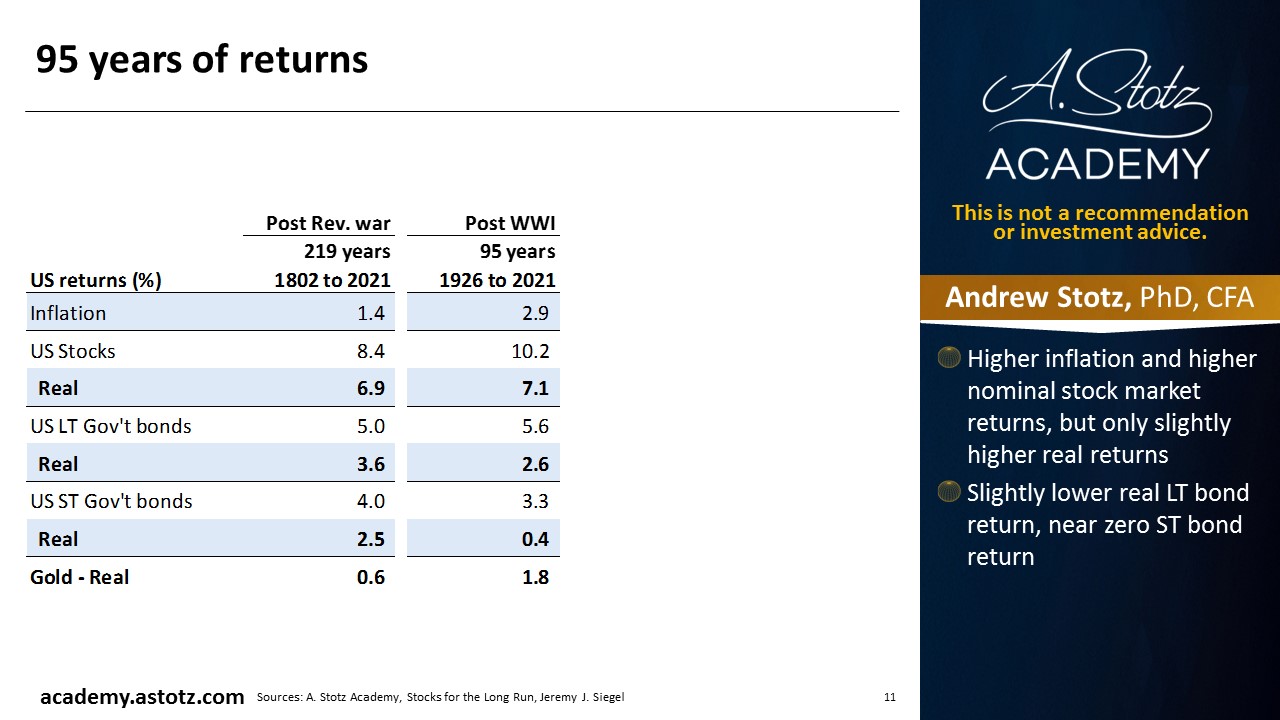
- Higher inflation and higher nominal stock market returns, but only slightly higher real returns
- Slightly lower real LT bond return, near zero ST bond return
Post WWII/Bretton Woods 75 years of high inflation
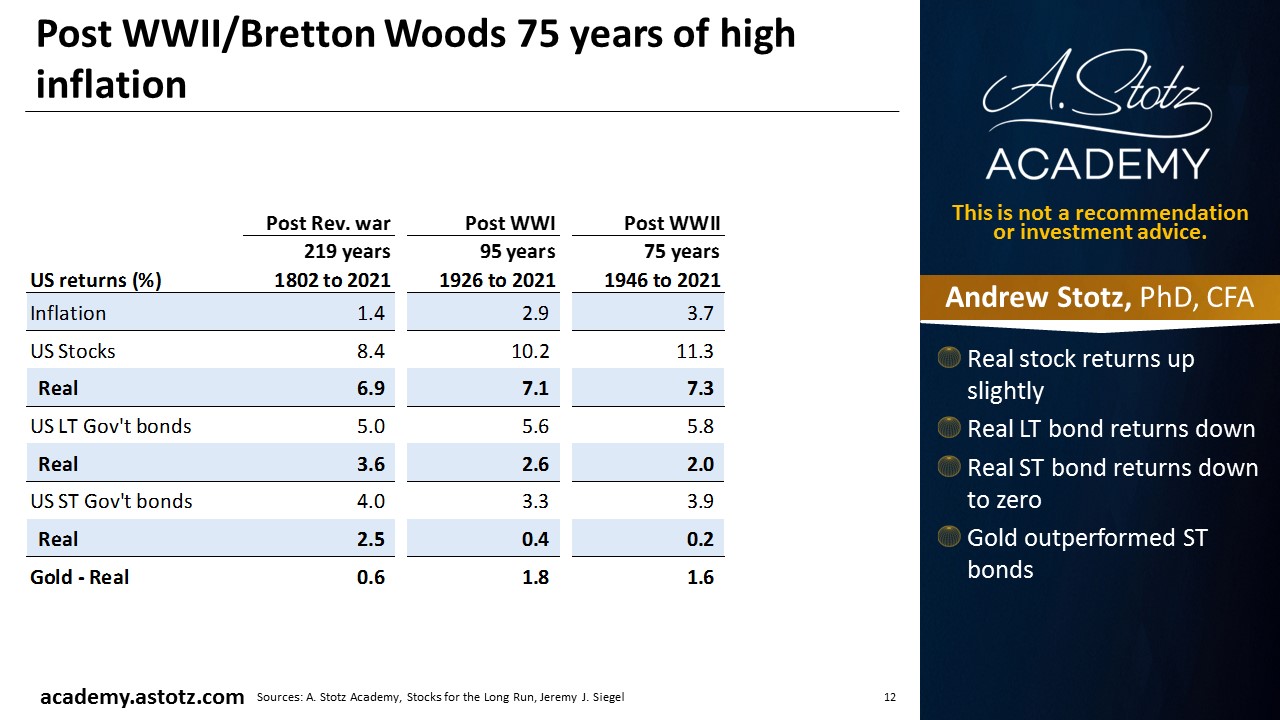
- Real stock returns up slightly
- Real LT bond returns down
- Real ST bond returns down to zero
- Gold outperformed ST bonds
The 21 years after the Dot Com bubble saw an unprecedented level of globalization
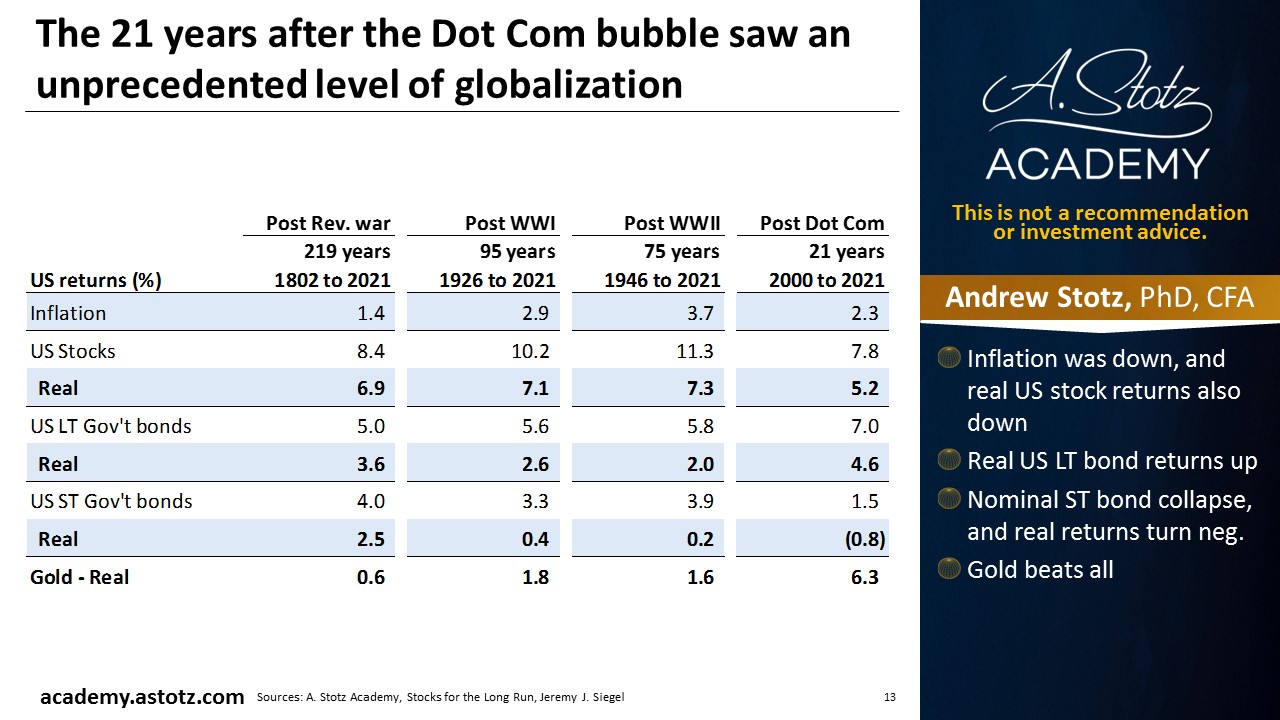
- Inflation was down, and real US stock returns also down
- Real US LT bond returns up
- Nominal ST bond collapse, and real returns turn neg.
- Gold beats all
Siegel’s advice
- Over the long-term, an investor has paid about 15x PE for about 6-7% after inflation US stock market return
- In the future, expect to pay about 20x PE for about 5% after inflation return