How to Benefit from Our Watching the Street Charts
How to read the consensus recommendations chart
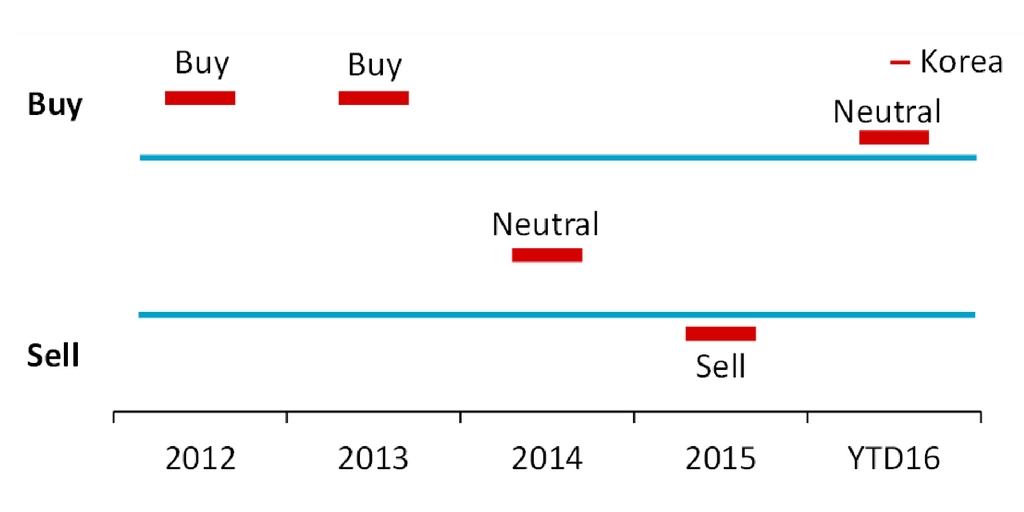
The chart below shows the aggregate strength of analysts’ recommendations within a country (in this example, Korea). The country is ranked relative to nine other Asian countries. Since analysts tend to be overly optimistic, we simplify the rank by countries, into Buy, Neutral, and Sell.
There are different levels of “Buy” and “Sell” at various brokers. For example, a five-tired rating system could have: buy, overweight, hold, underweight, and sell vs. a three-tiered system of buy, hold, sell. Due to differences in rating systems we normalize the recommendations to get a ranking of recommendations from sell to buy. We classify the 30% with the strongest recommendations as “Buy” and the 30% with the weakest recommendations as “Sell”, hence the remaining 40% is “Neutral”.
Methodology for consensus recommendations
- We gather Thomson Reuters’ Institutional Brokers’ Estimate System (I/B/E/S) consensus recommendations for every company in the country as of December each year
- We group all year-to-date recommendations into the current year
- We then do a bottom-up aggregation of all companies with at least three different analysts providing recommendations and then weight these by market capitalization to get the country average
- The composite country score is then ranked relative to the other nine Asian countries from Highest (BUY) to lowest (SELL)
How to read the consensus earnings estimates chart
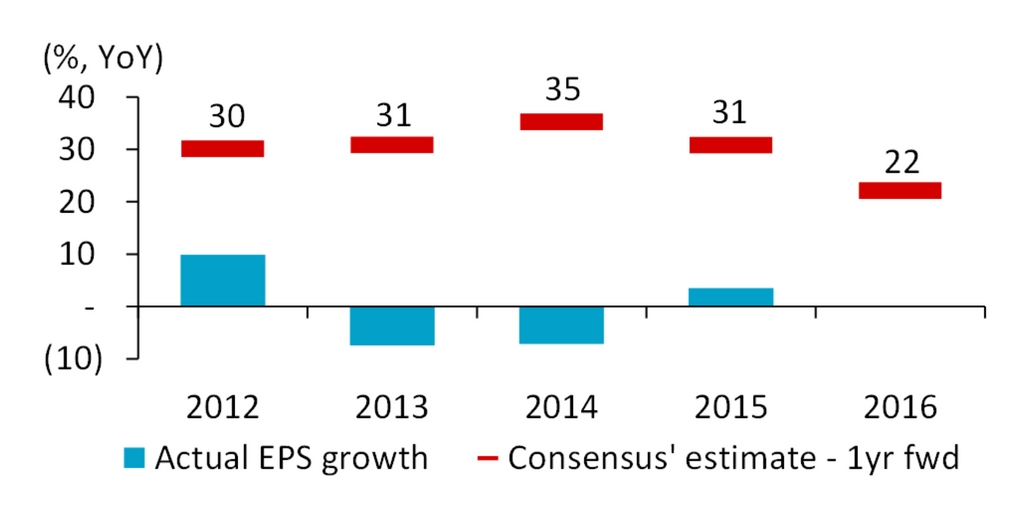
In the chart below, we display the consensus estimated EPS growth for the country. We measure one year forward, from March to March. Since it takes some time before a company’s results are reported, we use March, as by then the analysts should know the results of fiscal year ending December the previous year.
The red markers display what analysts’ forecasted the year-end EPS growth to be 12 months before it was known to the market and the blue bars show the actual EPS growth in each year. As we are yet to know the actual EPS growth for the last year shown in the chart (in this example, 2016) you will only see the EPS growth forecast.
Methodology for consensus earnings estimates
- We collect I/B/E/S consensus EPS estimates for every company in the country as of March each year
- We then do a bottom-up aggregation of all companies with at least three analyst EPS estimates in the year investigated, and from this we calculate a share-weighted country average
- To be included in any one year, a company needs to have at least two years of actual data to make it possible to calculate the actual EPS growth
How to read the consensus target prices chart
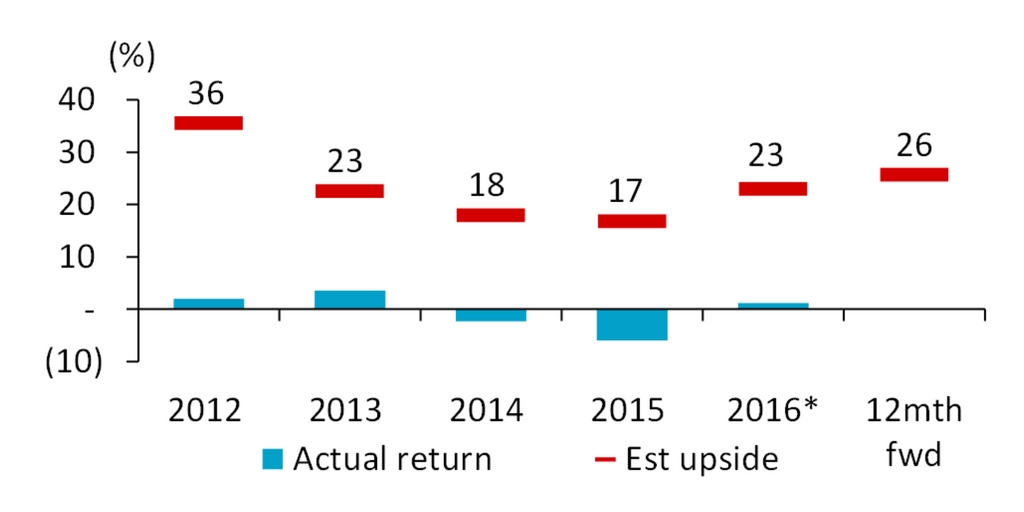
Visualized in the chart below is the average target price upside for all companies listed in the country. We use the 12-month period from March to March to arrive at the estimated upside each year as it takes time before a company’s fiscal year ending December results to be known to the public.
Red markers show the upside implied by the consensus analysts’ target price, the blue bars show the actual price return each year. For 2016*, the estimated upside (red marker) is as of March 2016, and the actual return (blue bar) is the actual return from March 2016 to year-to-date in 2016. The latest period included in the chart “12mth fwd” is the estimated upside implied by analysts’ most recent target prices relative to the current price as of the day the chart is made.
Methodology for consensus target prices
- We gather I/B/E/S target prices for every company in the country as of March each year
- We do a bottom-up aggregation of all companies with at least three target prices and then calculate a market-capitalization weighted country average
- The estimated target price upside is calculated by comparing the target price and the closing price as of March 31 in that year
Do YOU use any kind of analyst estimate when considering to invest in a stock?
Let us know in a comment below.
DISCLAIMER: This content is for information purposes only. It is not intended to be investment advice. Readers should not consider statements made by the author(s) as formal recommendations and should consult their financial advisor before making any investment decisions. While the information provided is believed to be accurate, it may include errors or inaccuracies. The author(s) cannot be held liable for any actions taken as a result of reading this article.