VMC: Analyzing Liquidity using Cash Conversion Cycle
This is a Valuation Master Class student essay by Lim Lee Bin from 15 April, 2018. Lee Bin wrote this essay in Module 4 of the Valuation Master Class. The post was originally published here.
Cash is like oxygen to a company. Regardless of how profitable a company is, if the business is unable to generate cash to cover its creditors, the company will run the risk of bankruptcy and collapse. One method to measure liquidity is the Cash Conversion Cycle (CCC). In layman context, CCC is an analysis of the duration between a firm cash collection and its disbursement and is calculated as Days to inflows – Days to outflows. In this essay, I’ll show CCC’s advantages over static liquidity measurement together with an illustration of the CCC mechanism. I would also touch on why every management desires to shorten inflow days and lengthen outflow days. Last but not least, I would also explain how declining/negative CCC can endanger or benefit a company.
Static liquidity ratio versus cash conversion cycle
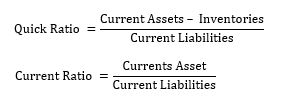
Besides profitability, liquidity is one of the vital ingredients for building a healthy and sustainable business. Its importance has been greatly emphasized especially after the 2007-2008 financial risks. Because of quick and ease of computation, static measurements like quick and current ratios A1 have gain popularity in measuring liquidity. But static measurements only quantify liquidity at a point in time and fail to account for the time span needed to convert current assets to cash or the time span needed to pay for the current liabilities. However, this limitation can be remediated by an alternative measurement call CCC, which incorporates the time element in its computation. Because of the time element feature, CCC is not a snapshot of business financial status like static measurement but a continuous process of monitoring the company’s financial health.
Demystifying cash conversion cycle method
CCC measures the amount of time required a company converts its resource inputs into cash flows. It is commonly used to assess the short and medium-term financial health of a company. The formula for CCC is as follows:
CCC = Receivables collection period + Inventory conversion period – Payables deferral period
Before we jump into the mechanism of CCC, we need to note that for CCC computation, we are mixing ratio from the Balance Sheet with the income statement. Because the balance sheet shows a snapshot valuation at a point in time while the income statement shows activity taken place over an entire period. We average the Balance Sheet number from the beginning and the end of the period while for income statement numbers, we would divide it by the 365. (number of days in a year)
From the CCC formula, we can see that CCC consists of 3 variables:
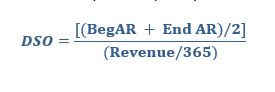
1. Days of Sales Outstanding (DSO)
DSO refers to the number of days needed to collect sales or account receivables. Management will prefer a smaller DSO because it means that the company is taking fewer days to collect its sales, which can be translated into more operating cash. Therefore, a short collection can be an indicator of efficient management. DSO is calculated by using average accounts receivable divided by revenue per day.
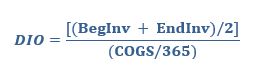
2. Days of Inventory Outstanding (DIO)
DIO refers to the number of days the company takes to sell the inventory. Slow inventory turnover is an indication that the product is not in demand, and inventory will become a burden. Therefore, management will prefer a smaller DIO because it means that the company is making sales quickly. DIO is calculated by using average inventory divided by Cost of goods sold per day.
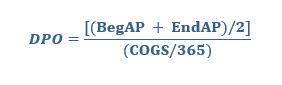
3. Days of Payables Outstanding (DPO)
DPO refers to the number of days the company pays its bills or account payables. Once the company pays the creditors, the money becomes unavailable. Therefore, management will prefer a higher DPO because it can free up more operating cash for other usages. DPO is calculated by using average Accounts Payables divided by Cost of goods sold per day.
Collectively DSO and DIO are called the Operating Cycle. Operating Cycle tells you how many days it takes for a company to process raw materials for collecting sales. Sometime CCC can also be called the net operating cycle as DPO is minus off from the operating cycle. CCC measurement on its own does not carry much meaning. It should be used relatively over several periods of time or compare to multiple competitors.
Illustration of the cash conversion cycle
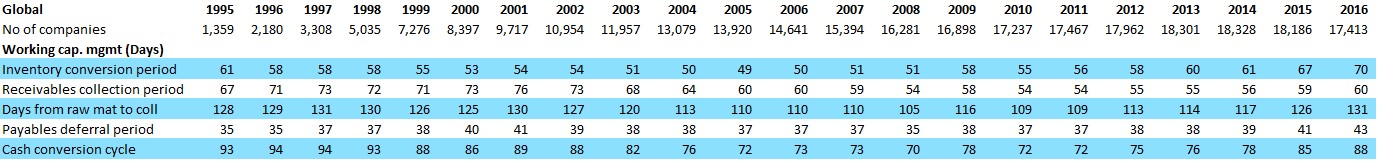
Using data provided by A. Stotz Investment Research conducted on CCC for global companies, we can observe that from 1995 to 2016, the average cash conversion cycle is positive, with an average of 82 days. Variances are also fairly stable, without huge movement between each year. You might wonder what does the average 82 days really mean? Does the company really need to have positive CCC? Can a company have a longer CCC? All these doubts will be crystallized below.
Using the CCC formula, we can calculate that the cash conversion cycle is 88 days (70+60-43) for 2016. Which mean on average in 2016, the company took 88 days to convert inventory to goods and service than to sales collection. A completed CCC diagram is shown below:

A positive CCC reflects that the company operating cash is tied up while waiting for the accounts receivable to be paid. During this period, operations need to finance internally or externally. If the operation is financed by debt, it can impose a considerable cost on the company, especially for companies with very long CCC. The longer the CCC, the higher the interest paid on the debt. Having a high CCC can a sign of operational issues like the product is not selling or a declining market, which reflects poorly on management efficiency.
The spell of the negative cash conversion cycle
While falling, CCC looks great on the surface but beware of the incoming danger, especially when CCC becomes negative. Declining or negative CCC can be a warning that the company is lacking funds to cover its liabilities to the creditors, especially if declining CCC is due to decreasing sales or increasing payables. Extended periods of negative CCC may even lead to bankruptcy and insolvency. But do note that some industries by nature tend to have low or even negative CCC.
So why does management desires falling CCC or even to the point of negative values despite knowing that negative CCC will run a high risk of not meeting short-term liabilities? It is because, from another perspective, a negative CCC is simply an interest-free borrowing from suppliers to finance the company operation. This allows the company to have a financial advantage compared to its peers. For example, instead of paying interest rate expenses to fund its short term asset, it can use the extra cash generated from negative CCC for other usages like invest in short-term investment to earn interest. This not only saves the interest cost but also earn some income out of it.
As illustrated, despite management’s desire for declining CCC, management needs to realize that negative CCC is a double-edged sword. If negative CCC is properly managed, it can greatly benefit the company but also pose great dangers if poorly managed. Therefore, management should exercise prudence when adopting a negative CCC strategy.
Conclusion
The cash conversion cycle complements static liquidity measurement. By understanding CCC and its components (DSO, DIO & DPO), it allows management to exercise financial flexibility over its peer, especially in declining or negative CCC. Despite the advantages, one should not forget the deadly danger associated with it.
References
1. Timothy P Connolly (2013) A Look at the Cash Conversion Cycle
2. A. Stotz Investment Research (Andrew Stotz) Average Cash Conversion Cycle for global companies data
Appendix 1
Join the Bootcamp for Valuation!
The Valuation Master Class is the complete, proven, step-by-step course to guide you from novice to valuation expert.
Save US$50 with coupon code: get-smarter
Click here to learn more and register.
DISCLAIMER: This content is for information purposes only. It is not intended to be investment advice. Readers should not consider statements made by the author(s) as formal recommendations and should consult their financial advisor before making any investment decisions. While the information provided is believed to be accurate, it may include errors or inaccuracies. The author(s) cannot be held liable for any actions taken as a result of reading this article.