Learning Valuation: M.C.S. Steel
Disclaimer:
This example was created on January 23, 2016. This is NOT a valuation, forecast, rating, or recommendation; rather, it is a teaching example. What follows is NOT investment advice; rather, it is a teaching example. It is intended only as academic information to those who want to learn about valuation. It should not be construed as the basis for any valuation or investment. The information in this presentation came from various sources which we believe are reliable, though we do not guarantee the accuracy, adequacy or completeness of such information. We hope you enjoy learning about valuation as much as we do!
Background
M.C.S. Steel Public Company Limited fabricates and distributes 70,000 metric tons of structural steel products annually.
The Thai company’s main product is high-grade steel beams predominantly used in the construction of high-rise buildings. Exports to Japan account for the vast majority of the group’s revenue, with the remainder primarily falling on domestic sales to local construction companies.
M.C.S. ships virtually all of its steel to major Japanese construction companies. The company supplies Nippon Steel & Sumitomo Metal Corporation – Japan’s largest, and the world’s third largest, steelmaker.
The company runs 12 factories, which are all situated in Pha Nakhon Si Ayutthaya province.
The 2015 revenue breakdown make one thing clear: this company is focused. 98% of that year’s revenue consisted of steel fabrication, and just 2% came from its steel scrap business.
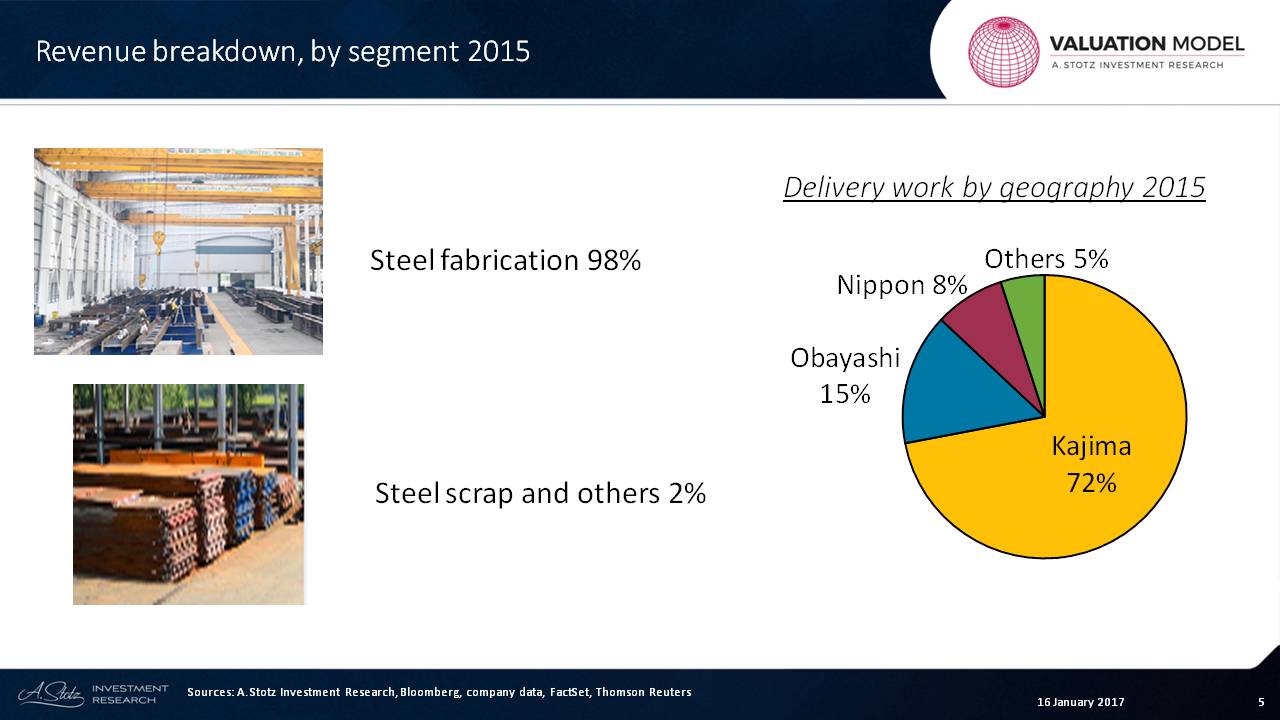
Japan’s Kajima Corporation made up a mind-boggling 72% of sales, with Obayashi Corporation and Nippon Steel & Sumitomo Metal Corporation supplying 15% and 8%, respectively.
On the plus side, this means the company is an export-focused corporation. However, this also means a whopping 95% of its customer base is in Japan, which places the company in an unusually reliant relationship with respect to the Japanese economy.
Now let’s get a rough idea of the forecast.
Forecast
MCS saw a very strong recovery in 2015, and that’s continued in 2016.
This recovery shows in the revenue growth. We can see that net profit growth has increased dramatically, and net profit margin has risen to 20%.
Over time, that’s probably going to fall.

Assets
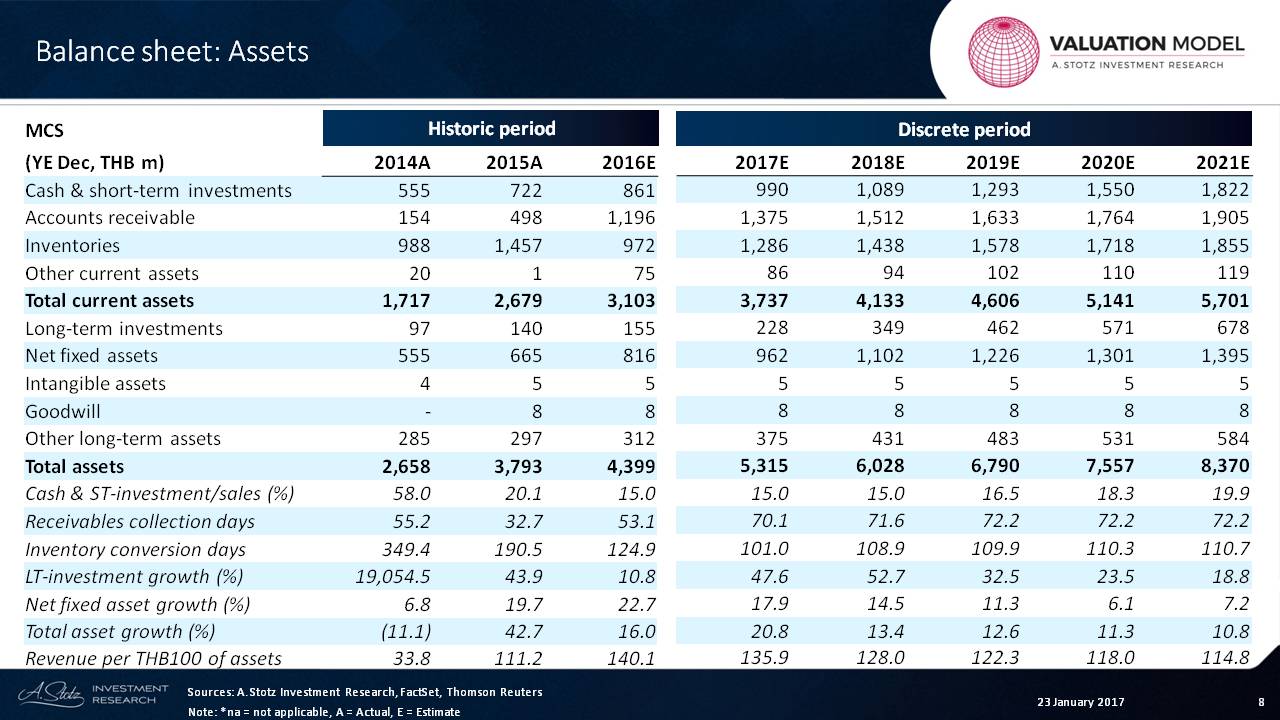
Now let’s look at the balance sheet and the total assets of the business.
The main thing about this business is that the net fixed assets have been growing by about 20% recently, and we’re going to taper that down over time.
As the company made a recovery, the revenues per asset or the total asset turnover has gone up to 140. We expect that to fall over time.
Liabilities and Equity
Let’s look at the liability side of the balance sheet.

We can see almost no debt from this company, both short-term and long-term. We have a little bit of debt, which is a balancing item. In our model, the overdraft section is the plug that allows us to make sure that the balance sheet balances.
We can see that the payables deferral days land between 90 to 100 days, and the dividend payout ratio sits at about 60%, which will increase up to 65% in the final years.
Cash Flow
We can see from this that the operating cash flow went from negative to positive, and we’re expecting that to continue to be positive. And then the large amount of dividend being paid out as profitability continues to rise as the dividend payout ratio rises slightly.
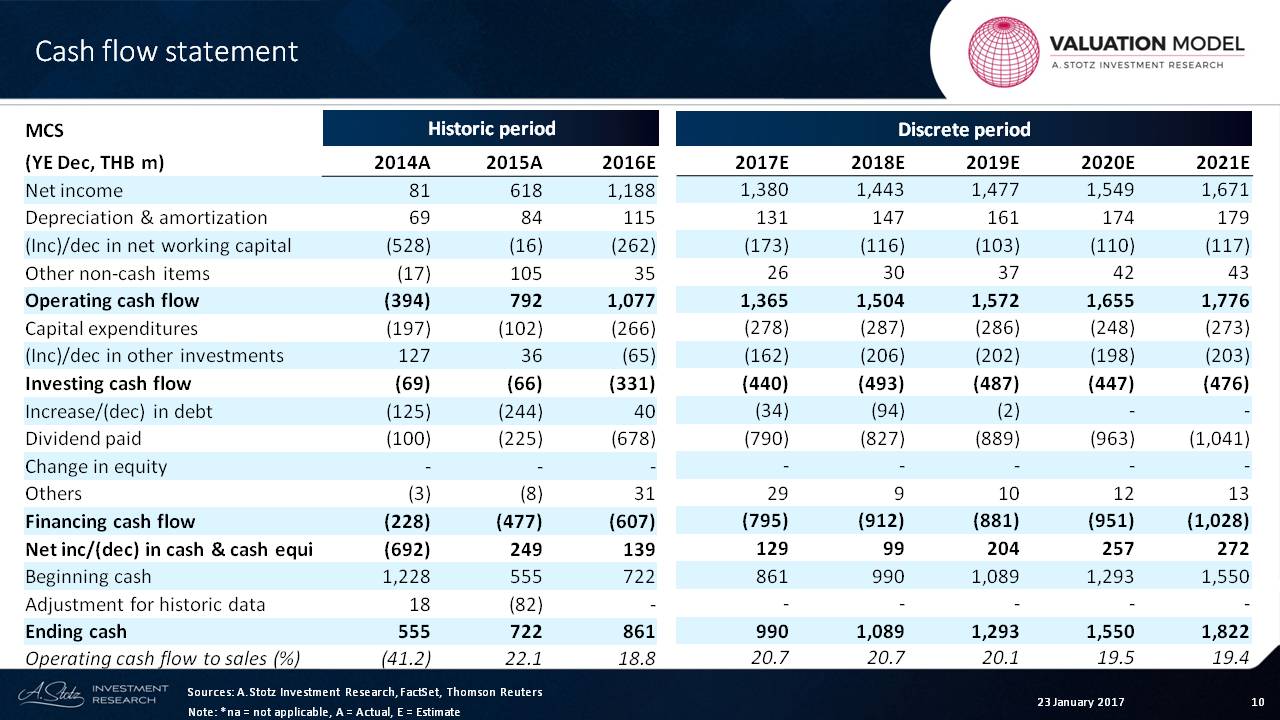
So the operating cash flow as a percent of sales is about 20%.
Free Cash Flow
First, we want to look at the free cash flow in our assumptions there. In the free cash flow, we start with the NOPAT ─ net operating profit after taxes.
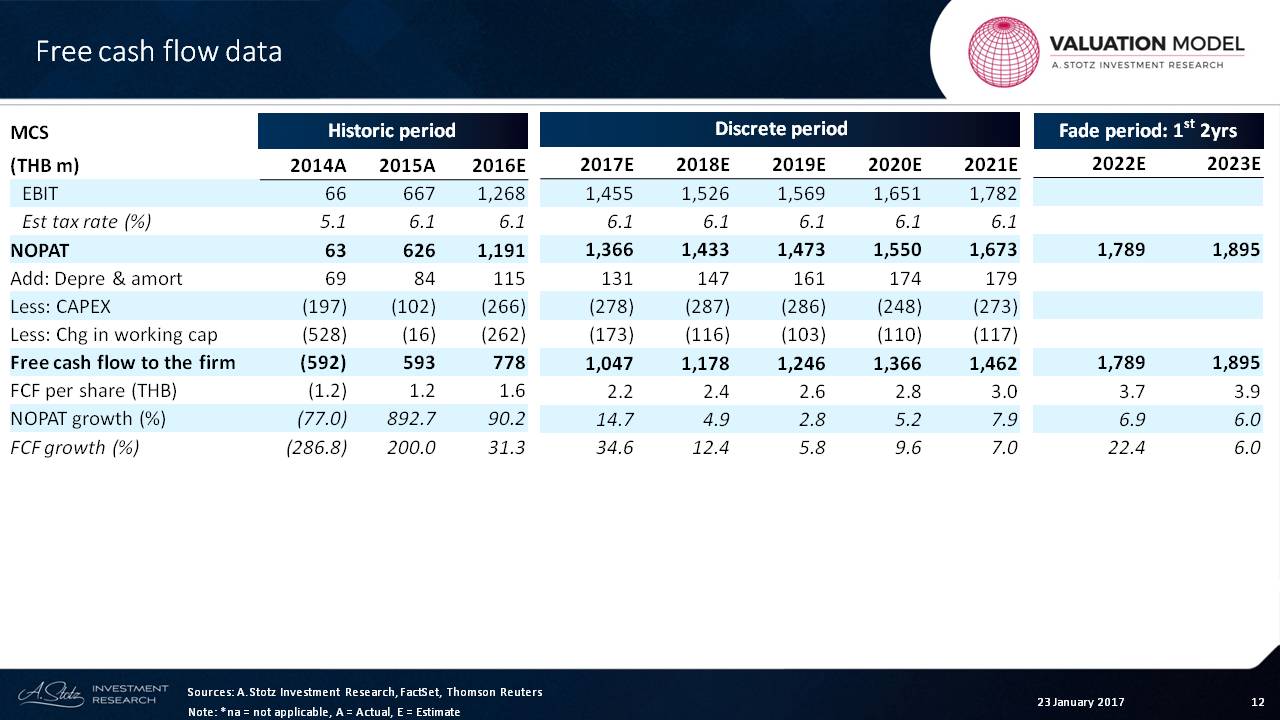
We add depreciation, take away CAPEX and we take away change in working capital. Of course, these two items are the investments that are required by that company.
And what we can see is that the free cash flow to the firm is growing steadily. We can see 34, 12, 5, 10, and 7. That’s our forecast right now for free cash flow to the firm.
Invested Capital
The next thing we want to do is look at the invested capital. We can see invested capital including cash and invested capital excluding cash.
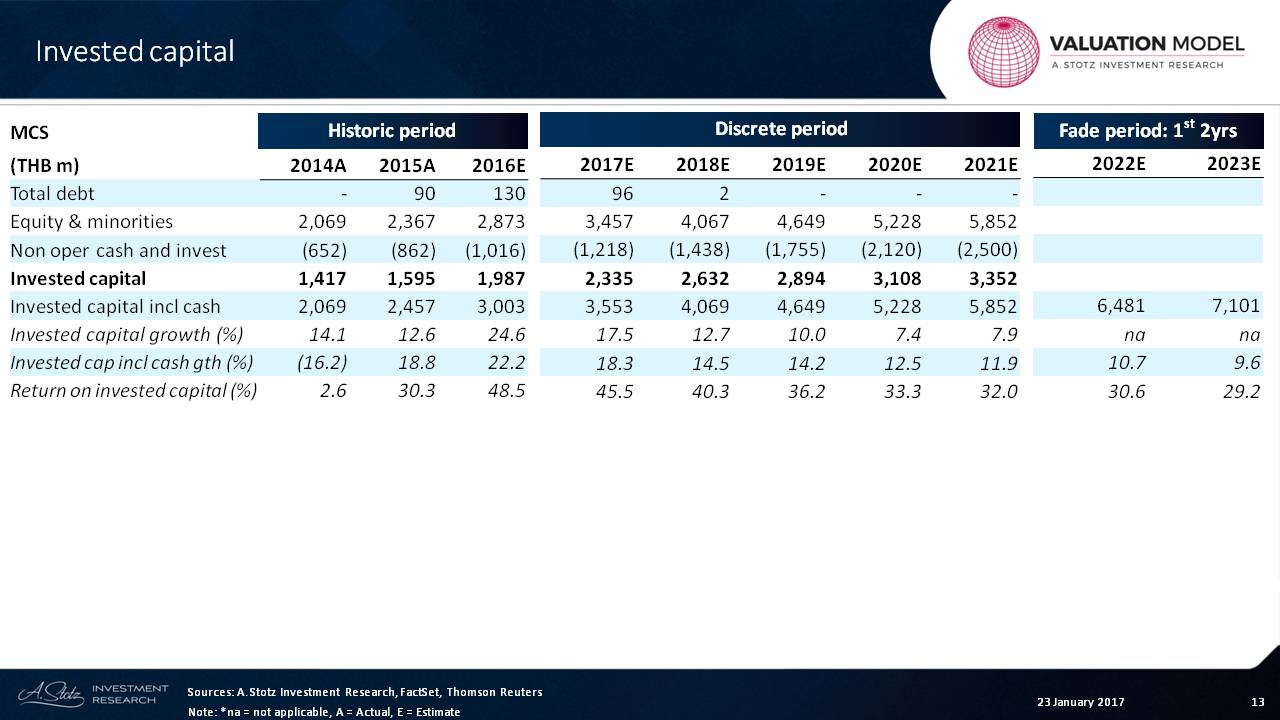
The one that we’re going to look is the line that includes cash, and here we can see a 12% or so growth rate, and that will come down to 10% and then slope from there.
The return on invested capital, of course, got massive, given the improvement they had over the last couple of years. We expect that that will taper down.
And in the fade period ─ this is just the first two years of the fade period ─ we’re going to see that taper down more.
Per Share
Finally, let’s look at the earnings per share of the company, which went from almost nothing up to 1.17 to 2.32. This is in Thai Baht. And we can see the growth there.
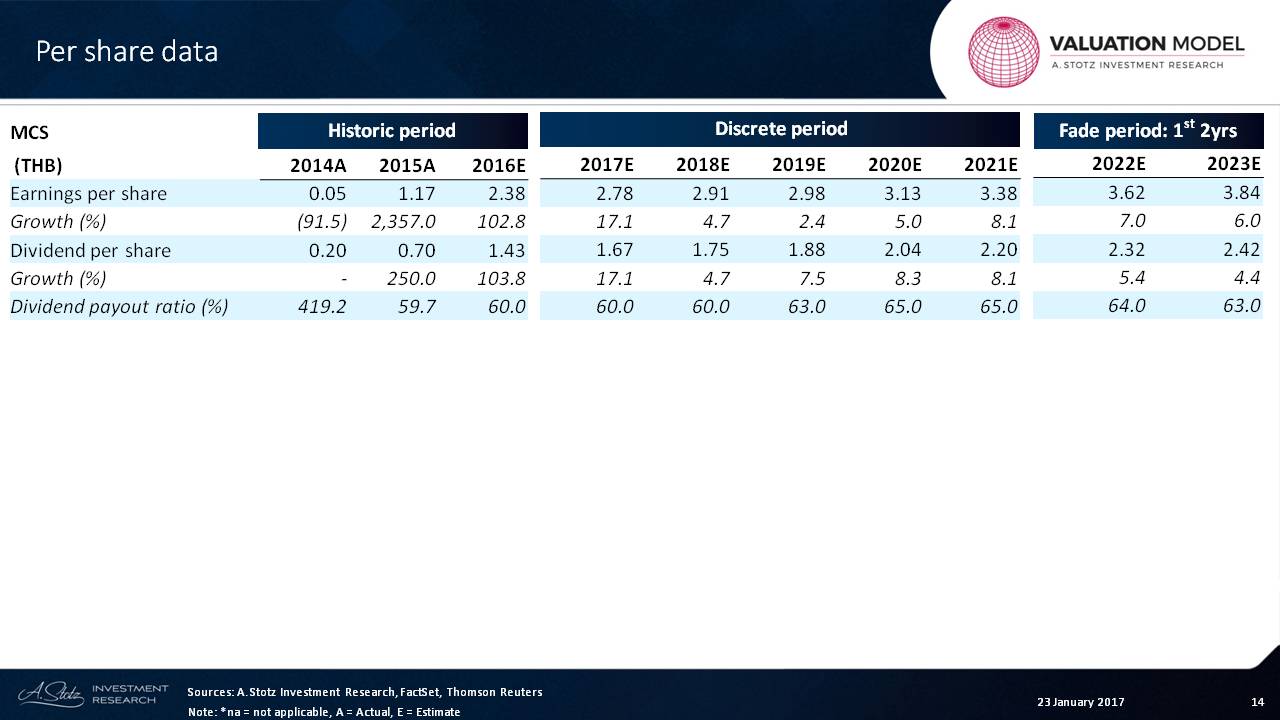
We do have a little bit of an increase here in the dividend payout ratio. So we can see that the dividends per share are outpacing the earnings per share in a couple of those years right here, when we were changing or increasing.
Cost of Capital
Now, let’s look at the cost of capital portion of the valuation.
Again, in Thailand, we’re assuming a 4% risk-free rate from now until eternity and a market premium of 8%, which gives us a market return of 12%. That’s our assumption across all companies in Thailand.
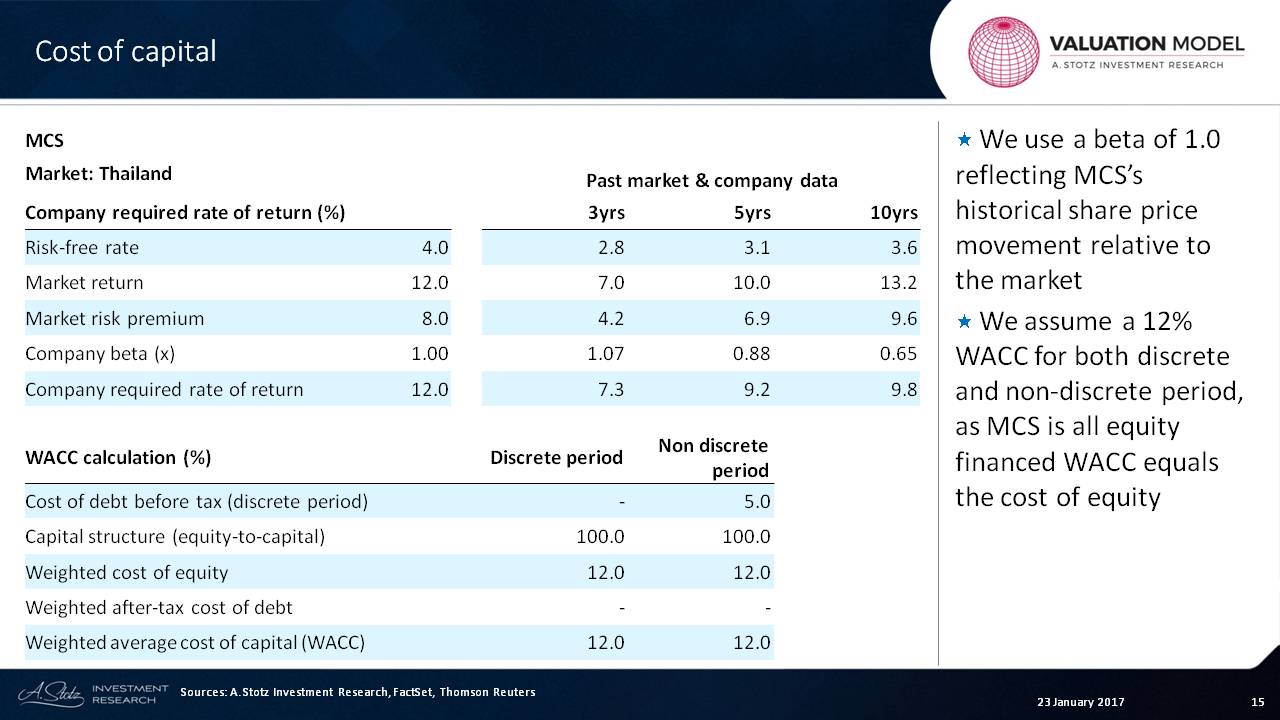
This company has a beta that has been very low, if we look at beta over a ten-year period, but closer to 1.0 recently. So we’re going to use 1.0. That gives us a required rate of return, or a cost of equity, of 12%.
There’s simply no debt in this capital structure. It’s all equity. Though, if that ever happens, we’ll put in a cost of debt at 5%.
So what we can see is that the weighted average cost of capital is going to equal the cost of equity.
Terminal Factors
Let’s figure out our assumptions on terminal growth rate ─ in this case, 3%.
So, when is our final discrete year? That would be 2021. And that’s where the line changes from blue to red.
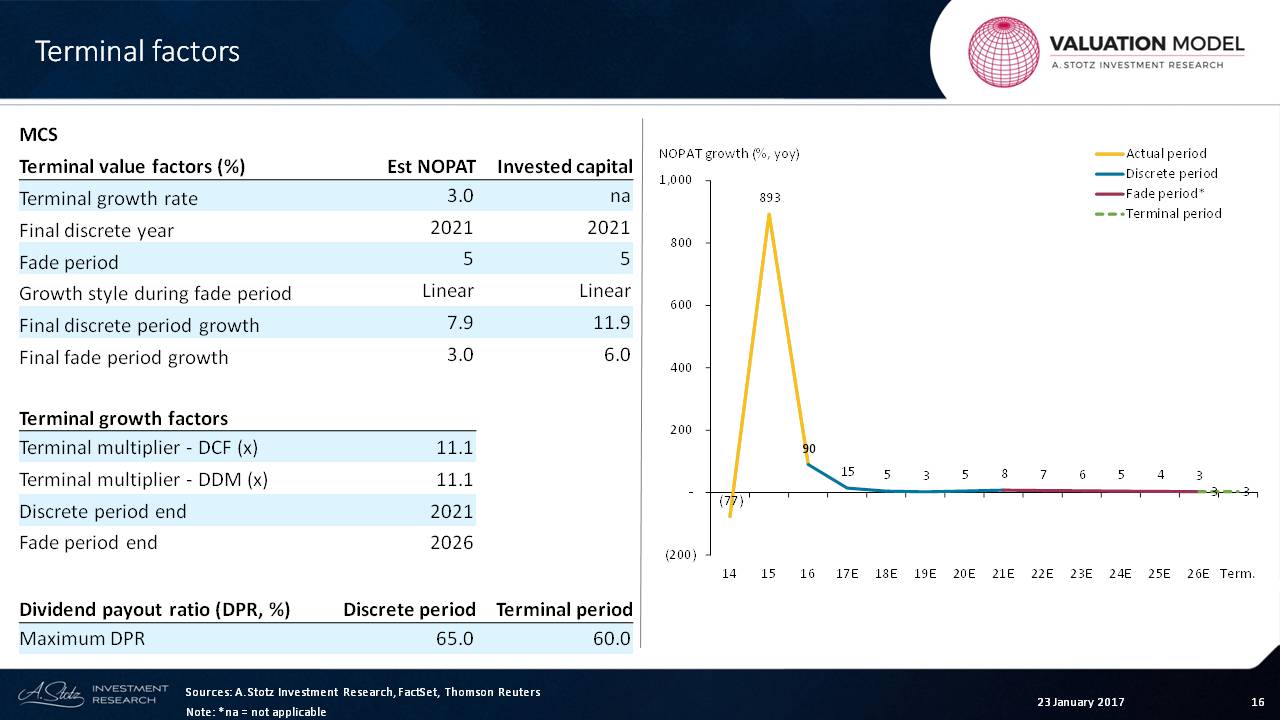
We have a linear fade period. The fade period is five years, and we can see that linearly falling until it ends at 3% in the final stages of the fade period.
In calculating the final terminal value, we need some growth factors and what we can see here is that the multiple is about 11x. So when we get to that final period, we’re going to use this multiple, which is not too high.
Absolute Valuation
If we continue, what we can see is that the absolute valuation that this leads us to shows how we value the discrete period, the five-year period and the terminal period.
We can see that about 32% on the DDM model is coming from the discrete period, 26% from the free cash flow, and 25% from free cash flow to equity.
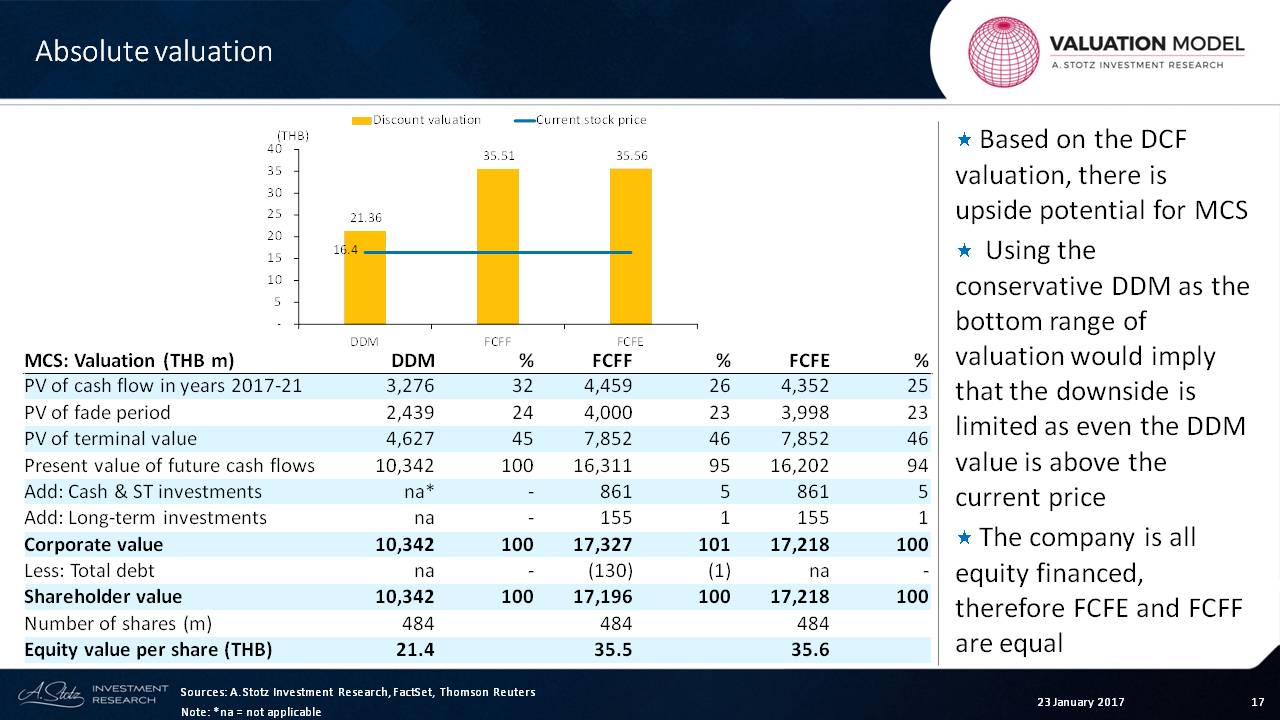
The end result is that we end up with a wide range of valuations. Of course, these two are basically the same because there is no debt. And we can see that each of these valuations in this chart is higher than the current price. The current price is right there.
So based upon the forecast we made and the absolute valuation, it seems like this stock is reasonably cheap.
Relative Valuation
But to really know whether a stock is cheap, we must compare it to other stocks in its sector. In this case, let’s compare MCS to the materials sector.
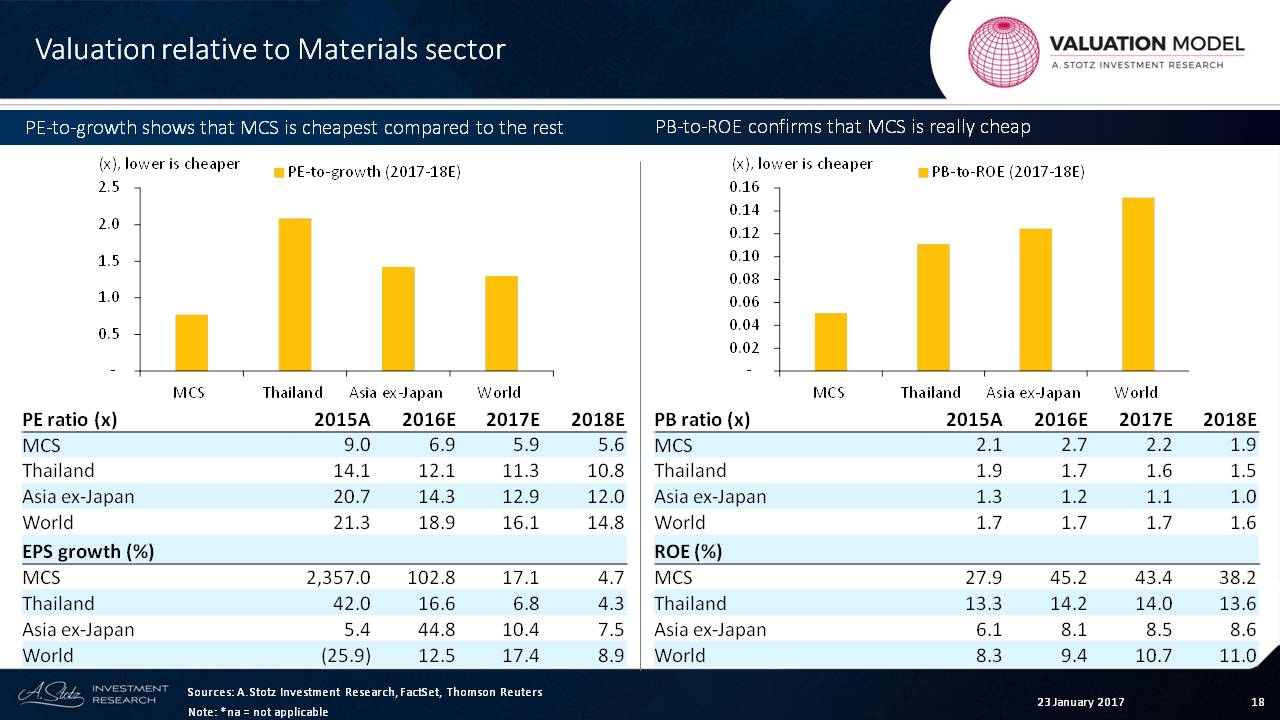
We look at the materials sector in Thailand, in Asia ex-Japan and in the world. What we see is that the PE of this company is very low and almost half of what it is for the overall sector.
The growth is pretty strong.
So if we look at it on a PE-to-growth ratio, we can see that the company here is cheaper than Thailand, Asia, ex-Japan, and the world.
If we switch over to the price-to-book value, we can see that the price-to-book value for this company is about 2x. It’s a little bit more expensive than Thailand and Asia. But what we can see is that ROE is massive compared to the other countries.
Therefore, the company appears to be cheap on a PB-to-ROE basis.
Sensitivity Analysis
Finally, let’s look at the sensitivity analysis. We look at sales, the profit margin, the discount rate and the terminal growth.
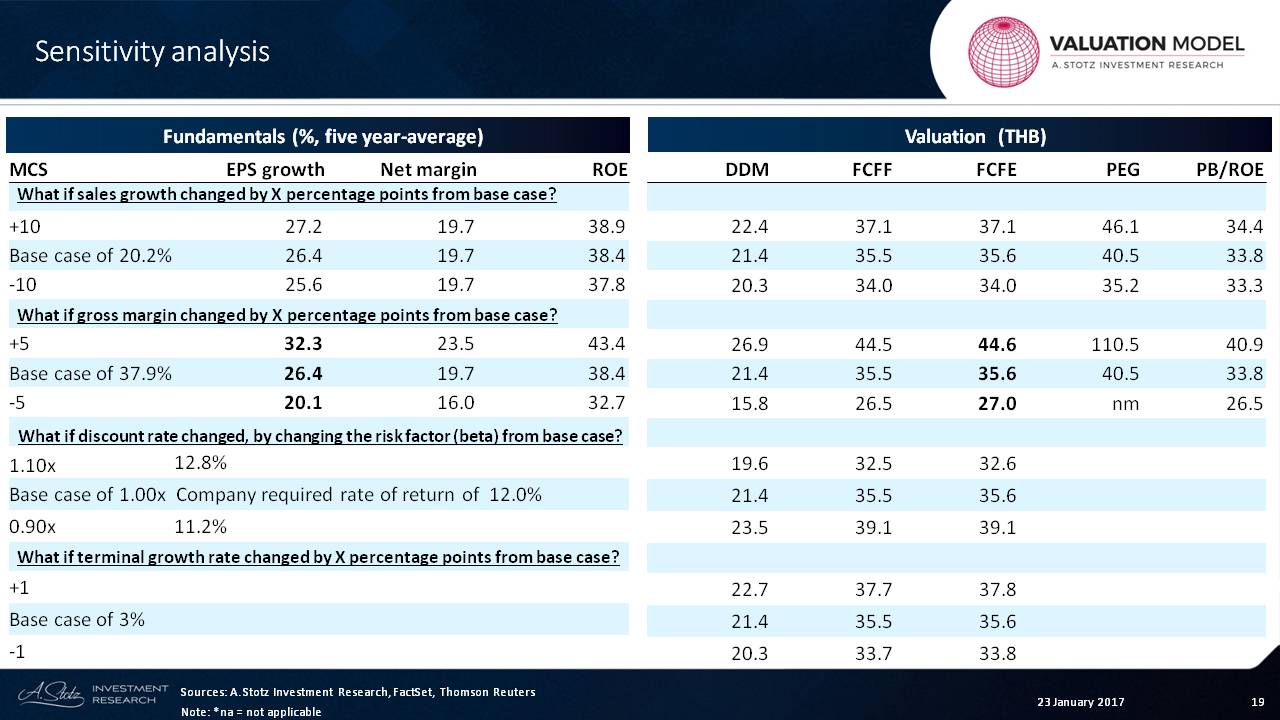
Basically, we can see that the highest sensitivity for most companies is gross margin.
If this company could increase its gross margin from 38%, to 43%, that would be an EPS growth rate of 32% instead of 26%. And if it fell from 38% to 33%, what we would see is that the EPS growth would come down to 20%.
If we look over on the valuation side, we can see that based upon those different scenarios, the valuation on a free cash flow basis could move from THB35.60 up to THB44.00 or down to THB27.00.
So that gives a background on the company M.C.S. Steel. Based upon what we see, it appears that the company is reasonably cheap.
Check out the World Class Benchmarking of M.C.S. Steel
Do you have any questions, comments or suggestions?
If so, leave them in the comments below and I’ll see you soon.