India Has Beaten the World Since 1997
Earnings growth and profitability in India are significantly higher than that in both Asia and the World as a whole. However, the Indian business community operates with higher balance sheet risk, as debt is somewhat higher in the majority of Indian sectors compared to the global average.
In our country profile, The World’s Fastest Indian (Economy), we showed that the fundamentals are strong in India. In fact, return-on-equity (ROE) expectations for 2017 are the second highest in Asia.
India’s ROE is superior to both Asia and the World
The chart below shows the historical ROE of India compared to Asia ex-Japan and the World. The data points in all charts below are based on our own bottom-up aggregates. The World is represented by the 15,000 largest companies on average around the globe. Asia ex-Japan is represented by the 3,600 largest companies in Asia. India is represented by an average of the 500 largest companies, since companies get listed and delisted every year.*

Only in 1997, 1999 and 2014 has the ROE for India not been higher than the Asian and global averages. Starting in the new millennium, profitability improvements were consistently top-notch until the global financial crisis. Indian ROE peaked at 24% during that era.
The average ROE for India from 1997-2015 was 16% compared to Asia at 10% and the World at 11%. ROE has been in a downward trend since 2010, a trend that has continued for Asia and the World, but India watched its ROE increase in 2015.
Three sectors in India delivered an ROE of 20% or above in the past 12 months: Information Technology at 25%; Consumer Staples at 23%; and Health Care at 20%. Materials and Real Estate, meanwhile, only generated 3% and 5%, respectively.
Earnings in India grow faster than the region or the World
Now let’s take a look at the earnings per share (EPS) growth since 1997. Asia in 1999 saw massive EPS growth as the region recovered from the Asian financial crisis that began in 1997. The World saw earnings fall by almost 50% as the dot-com bubble burst in 2001, followed by the big recovery in 2003.
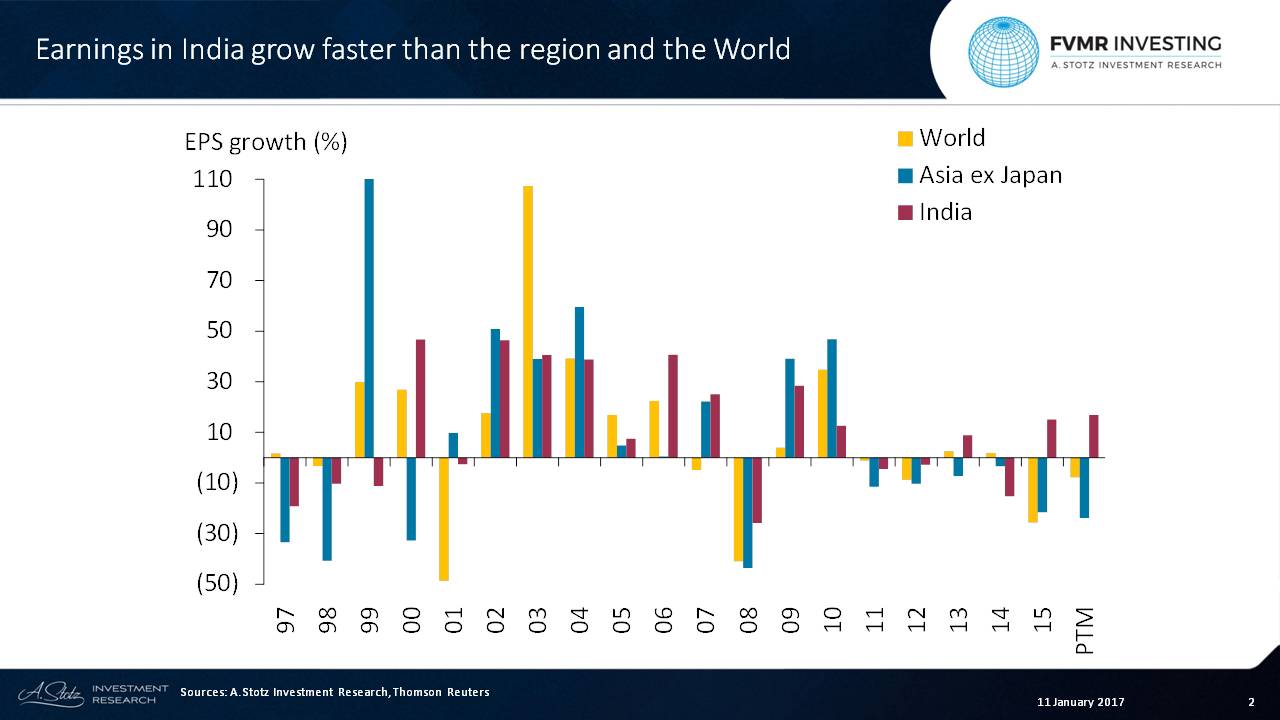
Considering the 2000-2015 period, the average EPS growth in the World and Asia ex-Japan has been 9%, while Indian EPS grew at an average rate of 16%. Looking at the past five years, the average EPS growth has been negative for Asia and the world, but just slightly above zero for India. Over the past 12 months, the EPS in India grew by 17%, while it contracted in both Asia and the World.
After 4 years of contraction, earnings among Indian industrials bounced back in 2015. Materials has shown a similar pattern, but earnings didn’t contract in 2013. The two sectors delivered the highest EPS growth in the past 12 months. The majority of sectors grew by double digits in the past 12 months. The exceptions were Information Technology, which grew by 4%, as well as Energy and Telecoms, which saw earnings fall.
India has higher gearing than the World or the rest of Asia
Our measure for gearing is net debt-to-equity. Disregarding 1997, the gearing in India remained below the World and in line with Asia ex-Japan until 2006.
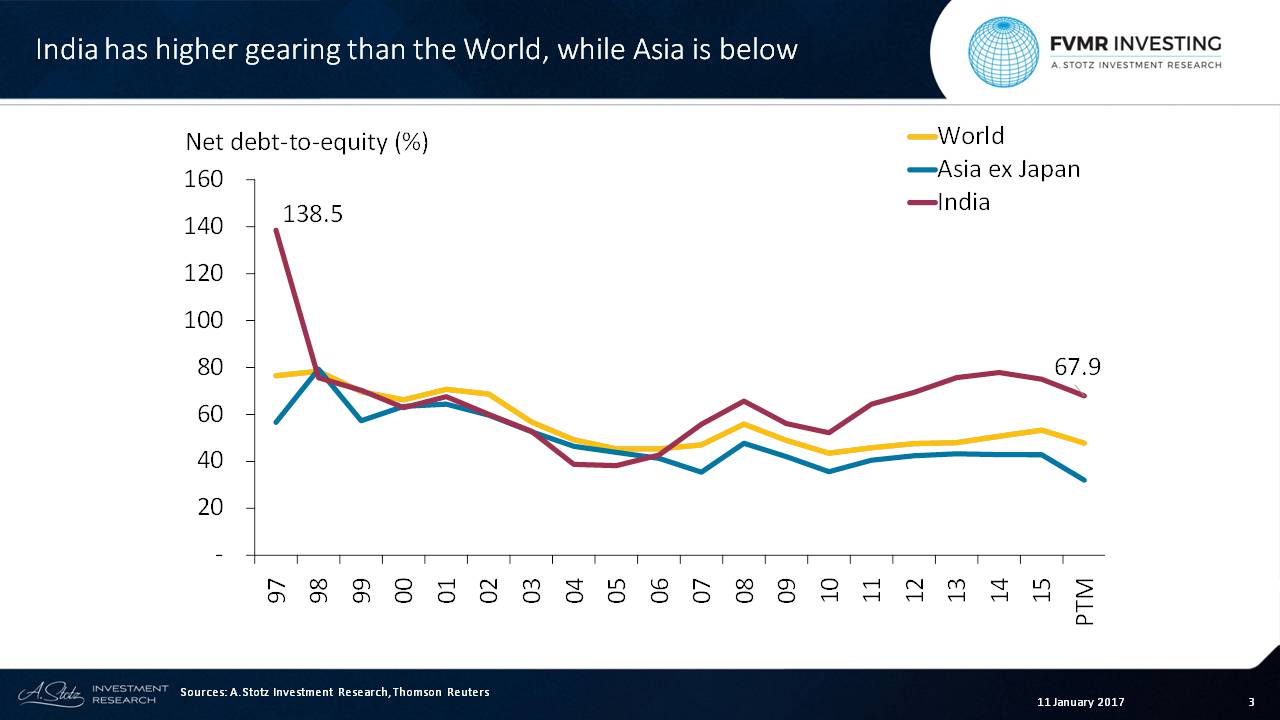
That trend diverged around the time of the global financial crisis in 2007-2008. Indian companies’ debt levels increased to a level above the global average. In the past 12 months, the gearing in India was 68% versus 48% for the World and 32% in Asia.
The absolute level of gearing among most sectors in India is higher than the global average, including relatively highly geared sectors globally such as Industrials, Telecoms and Utilities. The main stand outs in India compared with the rest of the World are the Consumer Staples and Health Care sectors, where the gearing is below the global average.
India’s ROE has been boosted by leverage in later years
As we could see that the gearing in India in higher, let’s take a look at Indian profitability in terms of return-on-assets (ROA) as well. ROA considers the return on all assets, hence a highly levered firm’s ROA will be lower than it’s ROE while for a firm with tiny debt ROA and ROE will be almost the same.

Comparing the chart above with the firs chart in this post showing the ROE of India, we can see that India’s profitability in the years 2010-2013 has been much closer to Asia and the World than what the ROE revealed. This was also a time period where India geared up compared to the benchmarks. Taking leverage into account, India hasn’t been that much more profitable in the past six years.
We can see that the companies constituting the Indian market on average are highly profitable. Earnings in the Indian market are also growing faster than the region and the World. This does, however, come with the cost of higher balance sheet risk. Taking this into account and considering ROA instead, it reveals that the leverage of India has boosted the ROE in later years.
*Since 2007, our Indian bottom-up aggregate has consisted of about 700 of the companies with the largest market capitalization. Note that the past 12 months (PTM) for India includes only about 400 companies as reporting standards in India differ and consolidated balance sheets are often only reported on an annual basis.
DISCLAIMER: This content is for information purposes only. It is not intended to be investment advice. Readers should not consider statements made by the author(s) as formal recommendations and should consult their financial advisor before making any investment decisions. While the information provided is believed to be accurate, it may include errors or inaccuracies. The author(s) cannot be held liable for any actions taken as a result of reading this article.