Learning Valuation: Mega LifeSciences
Disclaimer:
This example was created on 12 December 2016. What follows is NOT a valuation, forecast, rating, or recommendation; rather, it is a teaching example. What follows is NOT investment advice; rather, it is a teaching example. It is intended only as academic information to those who want to learn about valuation. It should not be construed as the basis for any valuation or investment. The information in this presentation came from various sources which we believe are reliable, though we do not guarantee the accuracy, adequacy or completeness of such information. We hope you enjoy learning about valuation as much as we do!
Background
Mega Lifesciences Public Company Limited is a manufacturer and distributor of pharmaceuticals, nutritional supplements and fast-moving consumer goods. It has a presence in 31 developing countries and has manufacturing facilities located in Thailand and Australia.
The company is also a leading distributor in Myanmar, Vietnam and Cambodia.
Mega We Care is its own brand of nutritional supplements, prescription pharmaceutical products and over-the-counter (OTC) products. It distributes products under the Maxxcare brand especially.
The company also operates as a distributor for various products including health supplements, pharmaceuticals, herbal remedies, and vitamins.
But let’s look at the revenue breakdown by segment first:
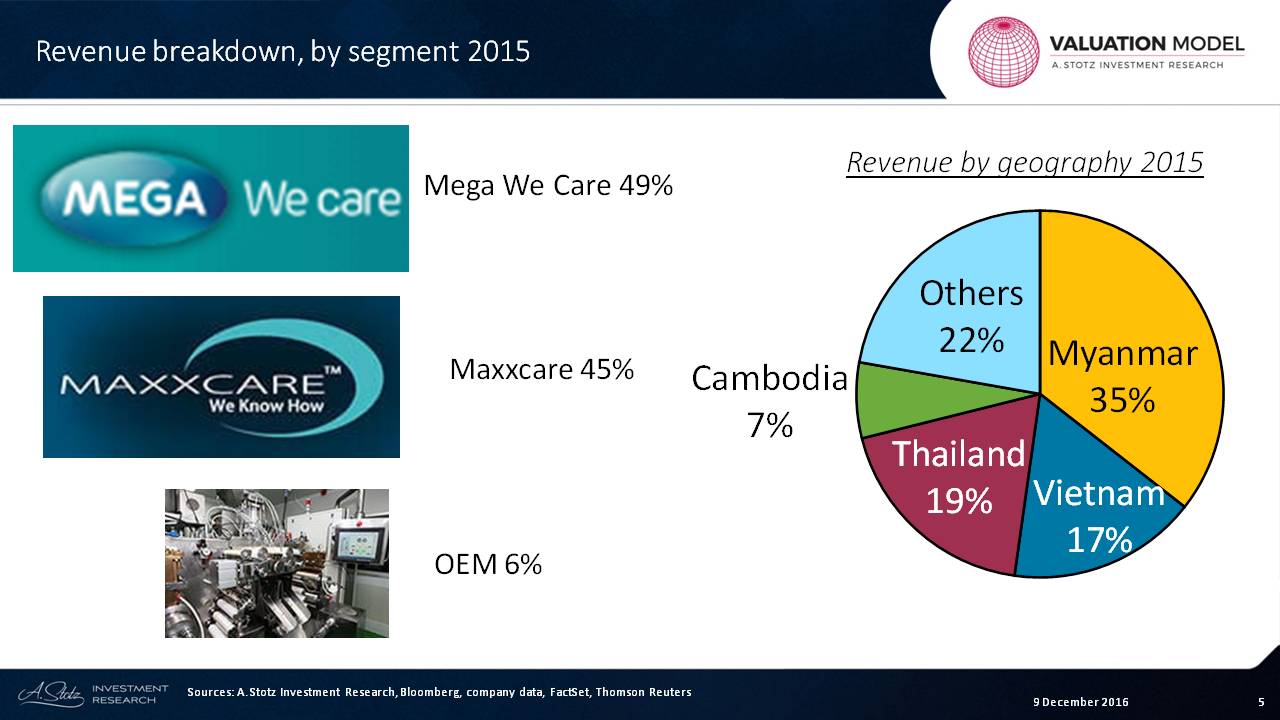
The Mega We Care supplied nearly half of revenue in the last year, while Maxxcare brought in 5%, and OEM, a fancy term fro distribution of others’ products was 6%.
If we look at the revenue by geography, we can see that Myanmar was 35%, Vietnam 17%, Thailand 19%, Cambodia 7%, and others 22%.
Learn more about Mega Lifesciences
Forecast
First, let’s go through and look at the company situation. Here, I give the output of a forecast.
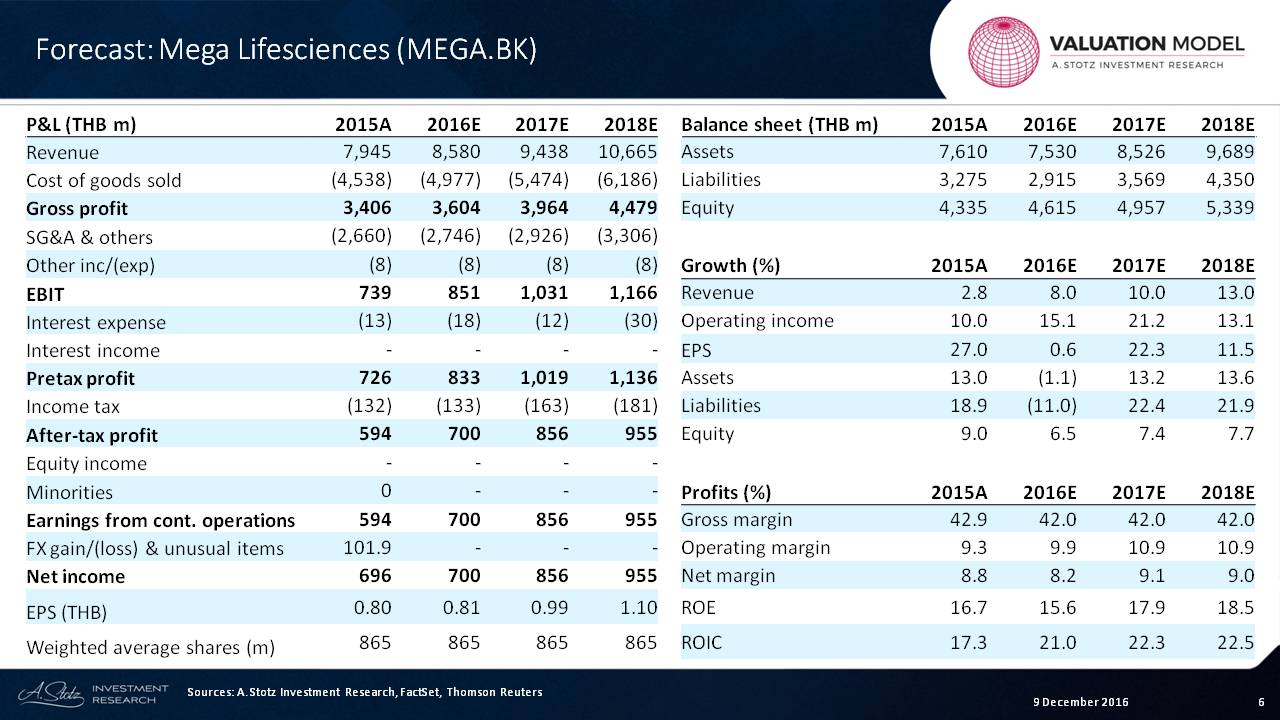
This is a made-up forecast ─ made up by me ─ and what we can see is that the net profit growth numbers that are assumed are right here.
We can see actual numbers: 696. Then, it goes to 700, 856, and 955.
Of course, creating the actual forecast ─ because this is an example ─ would take a lot more effort where we go into each of the revenue breakdowns by country and by product.
We can look at this simplified balance sheet here ─ assets, liabilities, and equities ─ and see that if we look at the revenue growth, we can see about 3% was last year (2015); then 10% and 13% are assumptions based upon nothing other than that I required a teaching example.
Now, we can see that the growth in EPS was 27%, then down to almost zero, then 22%, and then 11.5%.
And assets have been falling. We can see, so far in 2016, they’ve fallen. So let’s assume that they’re about -1% growth.
From these assumptions, we can see an output here showing that the gross margin assumption is about flat. Operating margin is about 5% but improving a little bit in the next couple of years. And then, we see net margin improving in the next couple of years.
We see the same exact trend going on with ROE and ROIC.
Absolute Valuation
Let’s move on to how you come up with an absolute valuation.
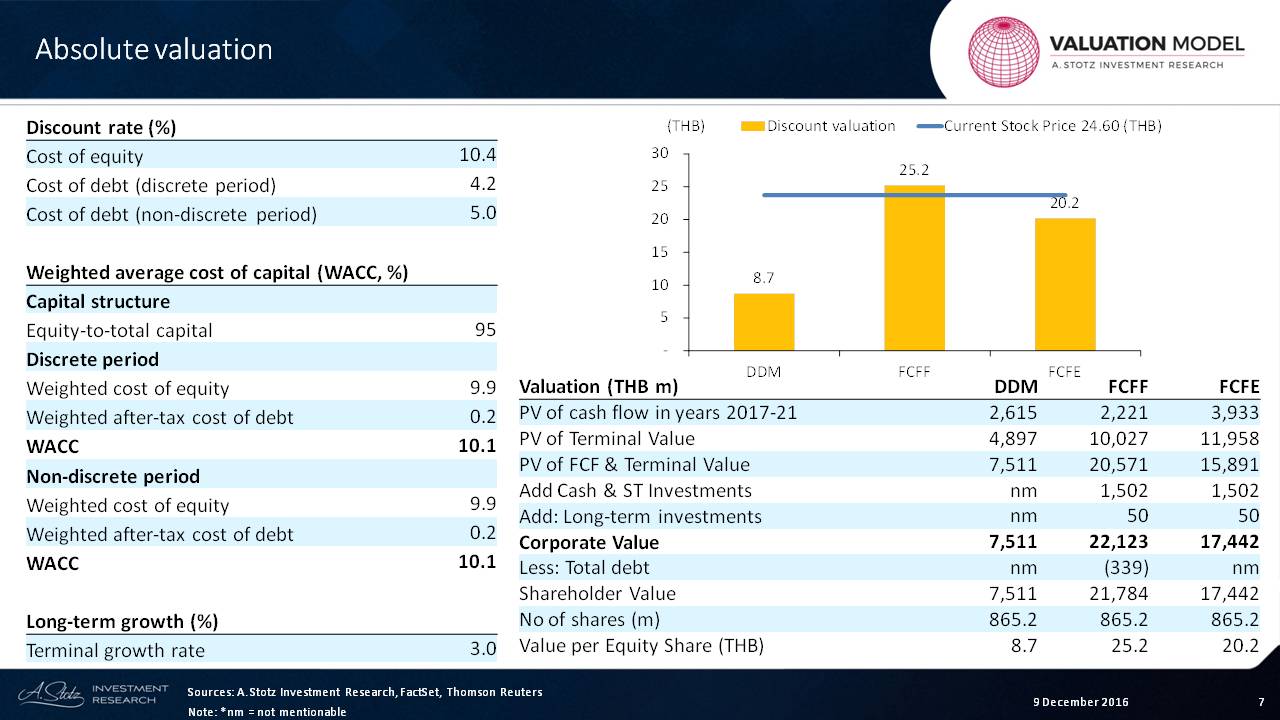
We start with the cost of equity. In Thailand, let’s assume a cost of equity of about 10%.
In this case, we are assuming a cost of equity for Mega of 10%, in fact, and a cost of debt of about 4% during the discrete period and a cost of debt at about 5%.
Now, of course, getting to this 10% has to do with the risk-free rate, the equity premium and all that. But for right now, let’s keep it simple and just show about a 10% cost of equity discount.
The capital structure in this company is 95% equity, and what we can see is that most of the capital is coming from equities. So a 95% percent weight times a 10% cost of equity gives about 9.9% in weighted cost of equity and a tiny little amount from debt.
That works out to a weighted average cost of capital of about 10.1% during the discrete period and also about 10.1% ─ let’s say, we’ll keep it the same ─ in the non-discrete or terminal period. We can see a long-term growth rate of 3%, and after that, we can see some of its outputs.
First of all, there’s the present value of the cash flows in the years during the discrete period. And whether we’re looking at a dividend discount model or a free cash flow model or a free cash flow-to-equity model, we can see various levels.
And then, the terminal value which we can see in the dividend discount model comes out to about 4,897. In the free cash flow model, it’s much bigger. And in the free cash flow-to-equity model, it’s much bigger. So almost all of the value of the company for the free cash flow models are coming from the terminal periods.
If we add these two up and then we add cash and other long-term investments because we are measuring free cash flow, then we can come up with the corporate value for the business.
After that, we take away debt, and we can come up with the shareholder value of the business.
Look at the number of shares, and we can come up with a wide swing in valuation from a DDM valuation of 8.7%, free cash flow to the firm of 25.2%, and free cash flow to equity of 20.2%.
Which one is right?
Well, that’s the art of valuation and that would require a lot more thinking. But, at least, this gives you a framework or an idea.
Relative Valuation
Now, let’s look at PE-to-growth. In this case, we can see that Mega’s PE ratio is based upon 2016 estimate numbers of 29.3.
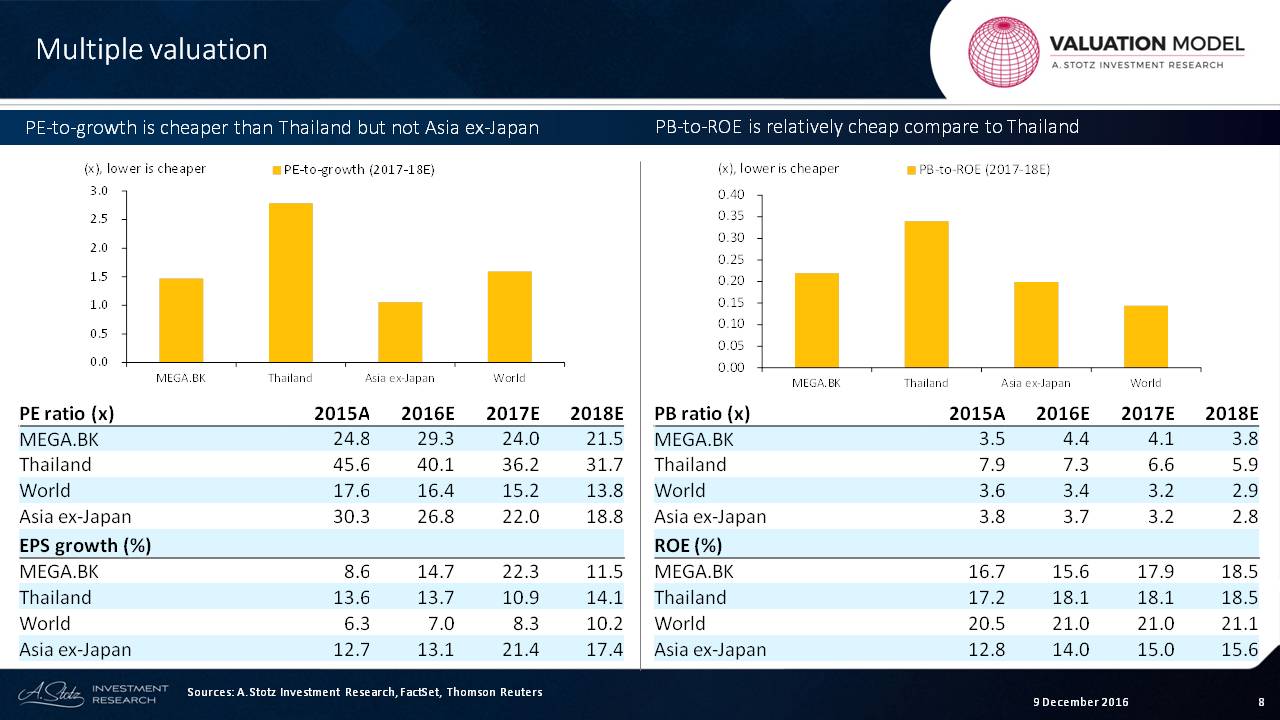
That compares to the health care industry in Thailand at about 40x.
And if we look at EPS growth of Mega in 2016, it’s about 14.7%, which is about the same for healthcare as a whole ─ about 13.7%
The healthcare industry in Thailand has very highly profitable hospitals. and they’re generally fast-growing and steady. Therefore, they tend to be ranked at a higher PE ratio.
So we can see on the PE-to-growth chart above that the overall PEG ratio is really high for Thailand, and we can see that lower is better for PEG ratio.
So it’s cheaper on a PE basis though it’s not exactly the same as a lot of the companies in the healthcare industry. We may want to compare Mega against some other specific companies, and we can see about the same amount of growth that you’re going to get in the others.
Now, let’s look at price-to-book and ROE.
The price-to-book at the company is at about 4.4 based upon the forecast numbers. And that compares to 7.3 for the overall industry. So it’s cheaper there.
And when we look at the ROE, it’s slightly less at 15.6% versus the industry’s 18.1%. It’s somewhat justified to have a lower price-to-book.
You could argue that the industry is pretty expensive. But it’s not just in Thailand. Around the world, we can see that the PE-to-growth ratio is a little bit high. But also for healthcare, we can see that in Asia ex-Japan, it’s ranked at about 3.7 for price-to-book ratio.
Sensitivity Analysis
Now, let’s move on and look at the sensitivity analysis. With this, we look at what if sales growth changed by x percent ─ in this case, let’s say, increased by 10%? What would happen to EPS growth?
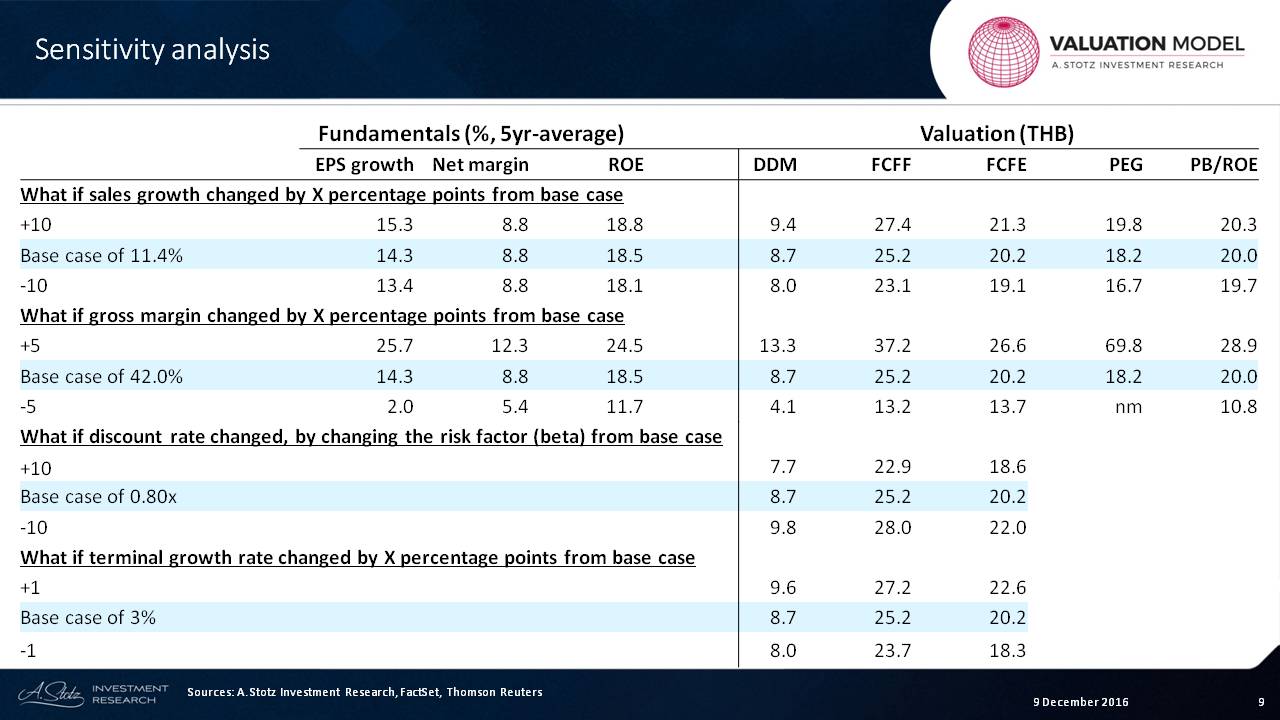
It would go from 14 to 15 ─ very little change in margin and in ROE but a higher change in the EPS growth. And we can see very little change if we reduce that.
If we look at the impact on value, we could see that the value would go up to 9.4 for dividend discount model in such a case.
If we look at the value based upon the PEG ratio, it would go up to 19.8 versus 18.2.
What if gross margin changed by, let’s say in this case, +5 percentage points?
That would go up to 47%. You can see right here that that’s a big increase, and it would have a major impact on growth. If it fell to 37%, what we would see is that it would really stifle the growth. And the value in the company would grow dramatically or it would collapse depending on which one of those we chose.
We can see that gross margin is very sensitive. But what about discount rate?
Discount rate doesn’t have anything to do with fundamental factors. And, therefore, we don’t have any data in here. The discount rate has to do with the discounted valuation model, so we don’t have any information over here in the Multiple Section.
And what we can see is that if the discount rate was to increase ─ meaning the risk assessment is higher ─ the value would fall from 8.7 to 7.7 if it went up by 10 points. And it would rise to 9.8 if it fell.
Finally, what if terminal growth changed?
Terminal growth would have a higher impact, generally, on the free cash flow methods because more value of the company was in the terminal value.
So this gives you an idea of how to look at a valuation. It’s an academic exercise and an example. I hope you learned from that.
Check out the World Class Benchmarking of Mega Lifesceinces
DISCLAIMER: This content is for information purposes only. It is not intended to be investment advice. Readers should not consider statements made by the author(s) as formal recommendations and should consult their financial advisor before making any investment decisions. While the information provided is believed to be accurate, it may include errors or inaccuracies. The author(s) cannot be held liable for any actions taken as a result of reading this article.