Learning Valuation: Malee Group
Disclaimer:
This example was created on January 23, 2016. This is NOT a valuation, forecast, rating, or recommendation; rather, it is a teaching example. What follows is NOT investment advice; rather, it is a teaching example. It is intended only as academic information to those who want to learn about valuation. It should not be construed as the basis for any valuation or investment. The information in this presentation came from various sources which we believe are reliable, though we do not guarantee the accuracy, adequacy or completeness of such information. We hope you enjoy learning about valuation as much as we do!
Background
Malee Group Public Company Limited, founded in 1964, produces and distributes its products for domestic and overseas markets.
It is engaged in manufacturing canned food, beverages, vegetables and meat under the Malee, First Choice, Hunter and Farmer brand names.
It holds about a 25% market share in the premium fruit juice market in Thailand.
The products under the Malee brand are divided into two groups ─ beverage products: juices, coffee, water and milk; and processed fruits and refreshments: canned fruits, sweet corn and ready-made refreshments.
The company also does contract manufacturing: producing goods in accordance with customers’ requirements under their own brands.
The recent announcement of a 49%/51% JV with Mega Lifesciences (MEGA TB) aims to develop scientifically-proven natural food and beverage products for the domestic and overseas markets.
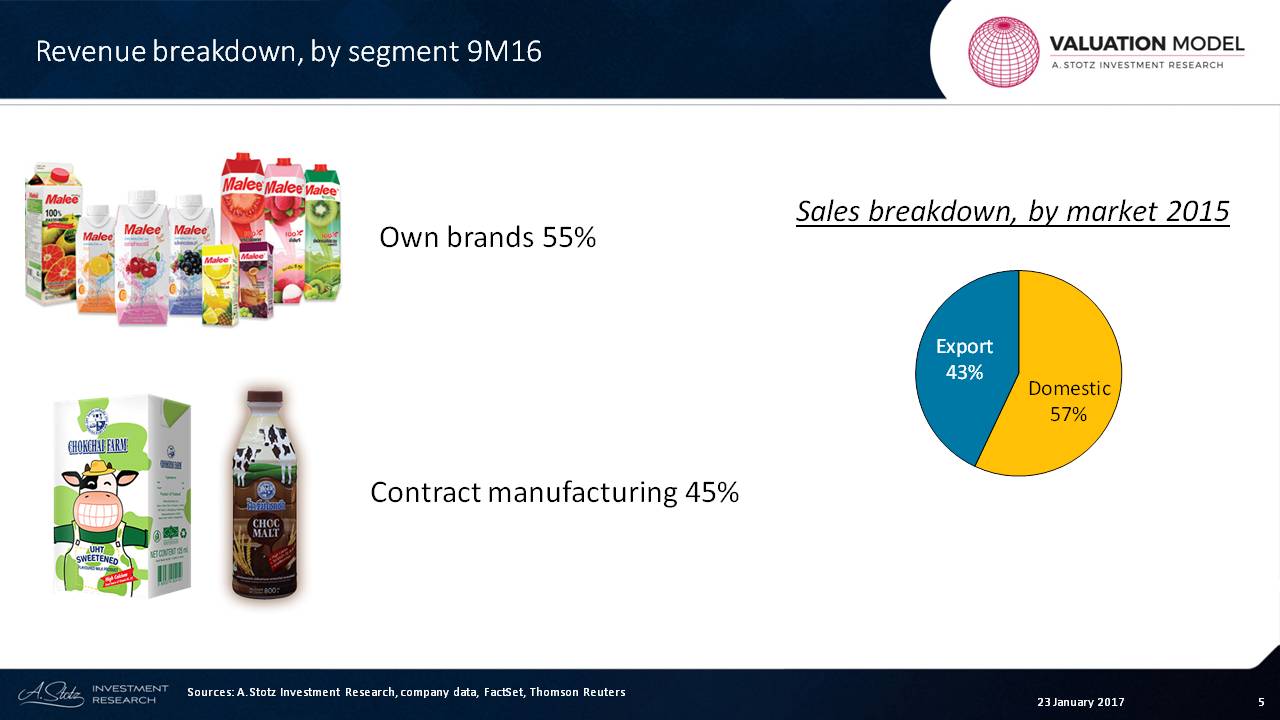
Their own brands account for 55% of revenue, with contract manufacturing accounting for the other 45%. And 57% of the sales breakdown are domestic sales.
Forecast
Of course, when you value any company, you’ve got to make a forecast. So let’s give it a go and see what we can come up with.
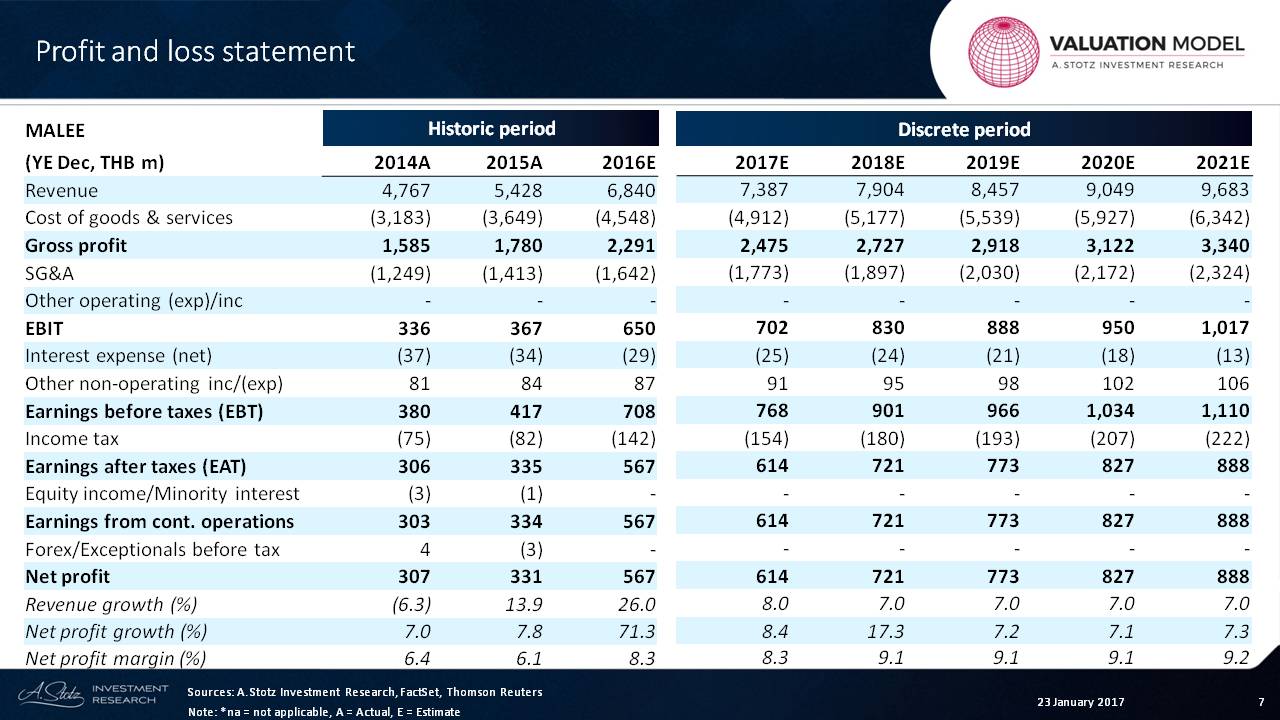
What you can see here are the historic and the discrete periods.
2016 is part of the historic period even though we’re still forecasting it, because we don’t do the valuation off of 2016. Rather, we do it off of the 2017 numbers.
The company has about a 7% to 8% growth rate. The net profit margin has come up from 6% to 8%, and we’re going to keep it at about 8% to 9%.
So we’re assuming that the company’s profitability is good over the next couple of years.
Assets
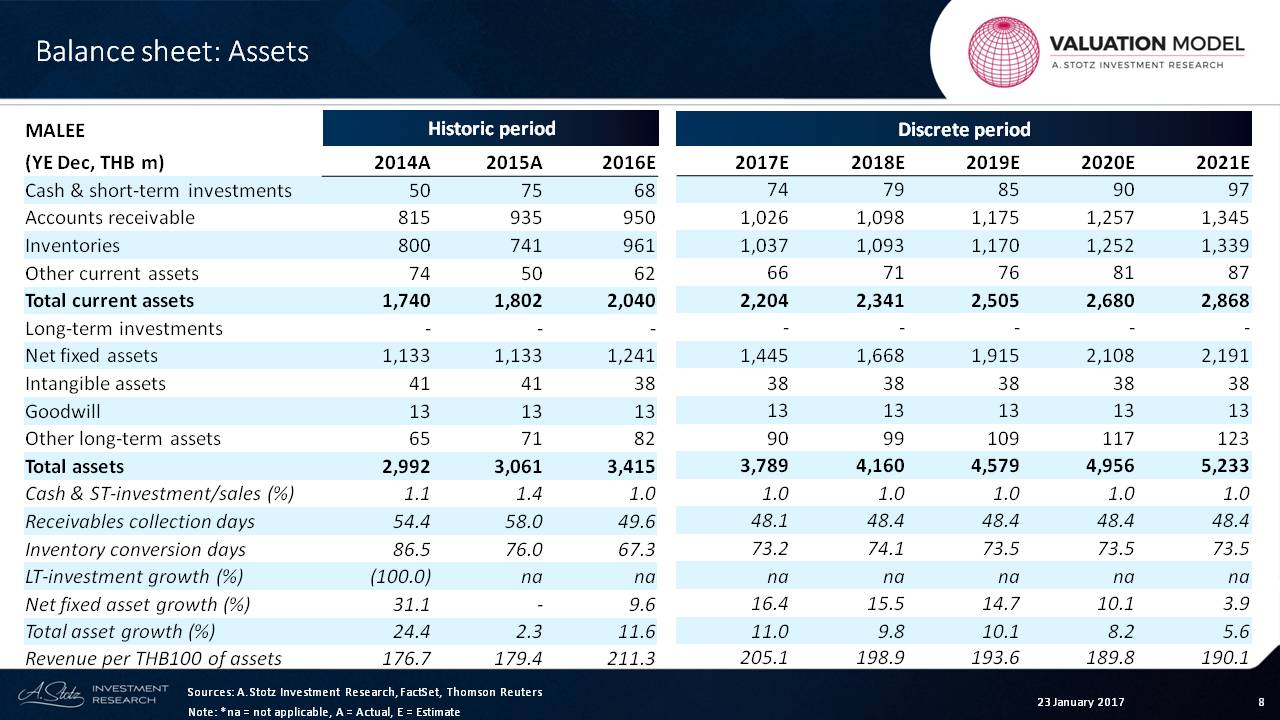
The next thing that we can see is that the company is growing its net fixed assets recently but that has slowed down a bit over time. The revenue per assets went from 176 up to 211. We then expect that that will fall a bit over time but not by too much.
Liabilities and Equity
What we can see is that the company’s payables are about roughly 40 days, and we’re going to keep it that way.

We can see up here in the long-term borrowing section a very small amount, so let’s just keep a little growth right there.
The dividend payout ratio is about 50%.
Cash Flow
If we move on to the cash flow statement, what does all this mean?
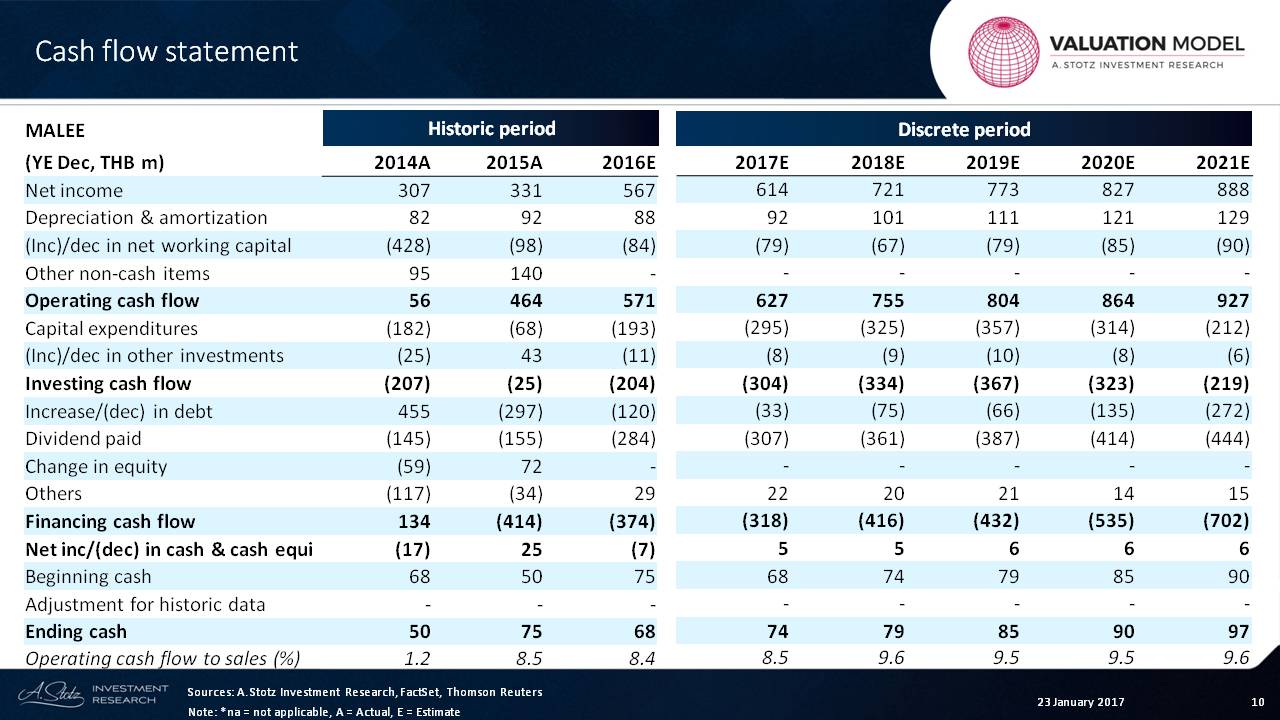
We can see that cash flow has been strong, and we expect it to be stronger going forward.
Overall, operating cash flow to sales has been about 8%, roughly as we saw that profitability was rising. That number tends to rise when profitability is rising.
So that’s operating cash as a percent of sales.
Free Cash Flow
Now, let’s take that forecast and go through our valuation process.
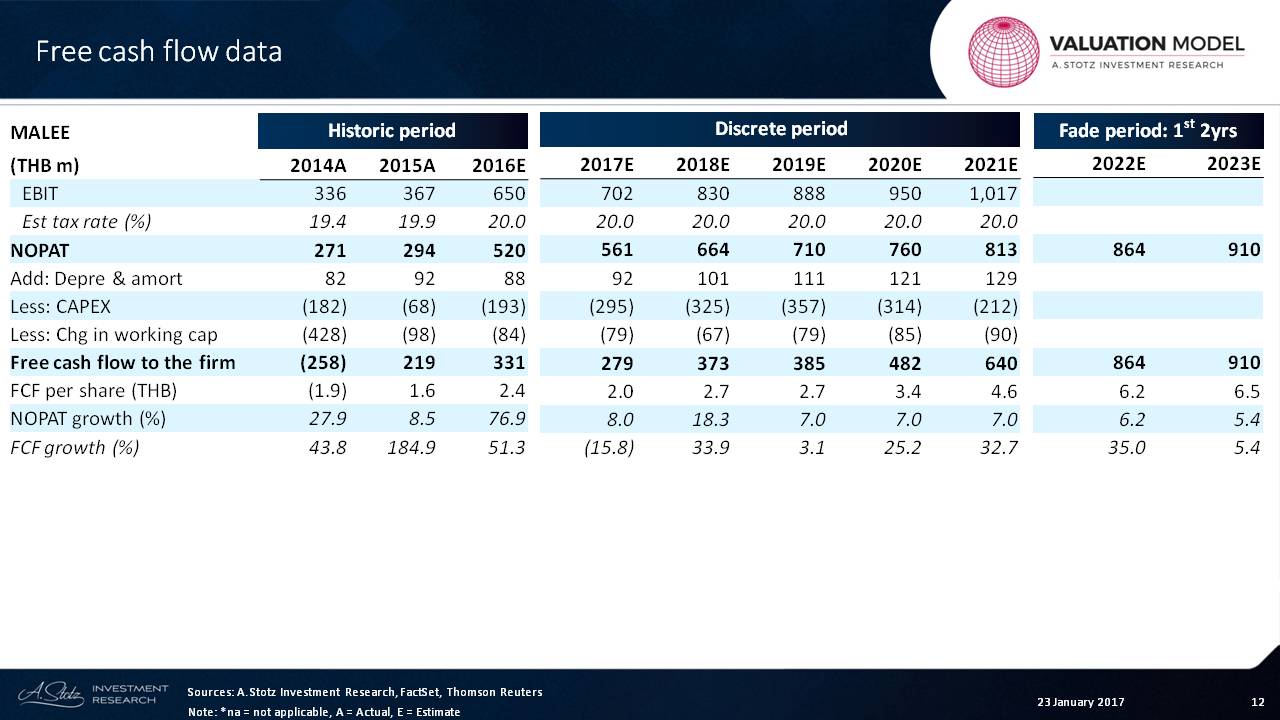
The first thing we want to do is understand the free cash flow that this implies. We can see the company’s earnings before interest and taxes here. Then we take away taxes, and we get net operating profit after tax.
We can see that number growing, and then here we go into the fade period.
What really matters is the amount of depreciation CAPEX and the like. And we can see those numbers right here ─ the CAPEX slowing down as we saw fixed assets slowing a bit.
The end result is the number we really want to look at, free cash flow to the firm. What we can see from the free cash flow to the firm is a bit of sporadic growth, which is not uncommon.
Why is that?
Mainly, that’s because the working capital tends to be a little bit sporadic.
But from that, we can see a pretty strong growth in free cash flow to the firm, particularly in the discrete period where we can see that it’s about 25% to 30%.
Invested Capital
Now, we also want to look at the invested capital that the company has and the growth in that invested capital. We can also include cash in that or we can exclude it.
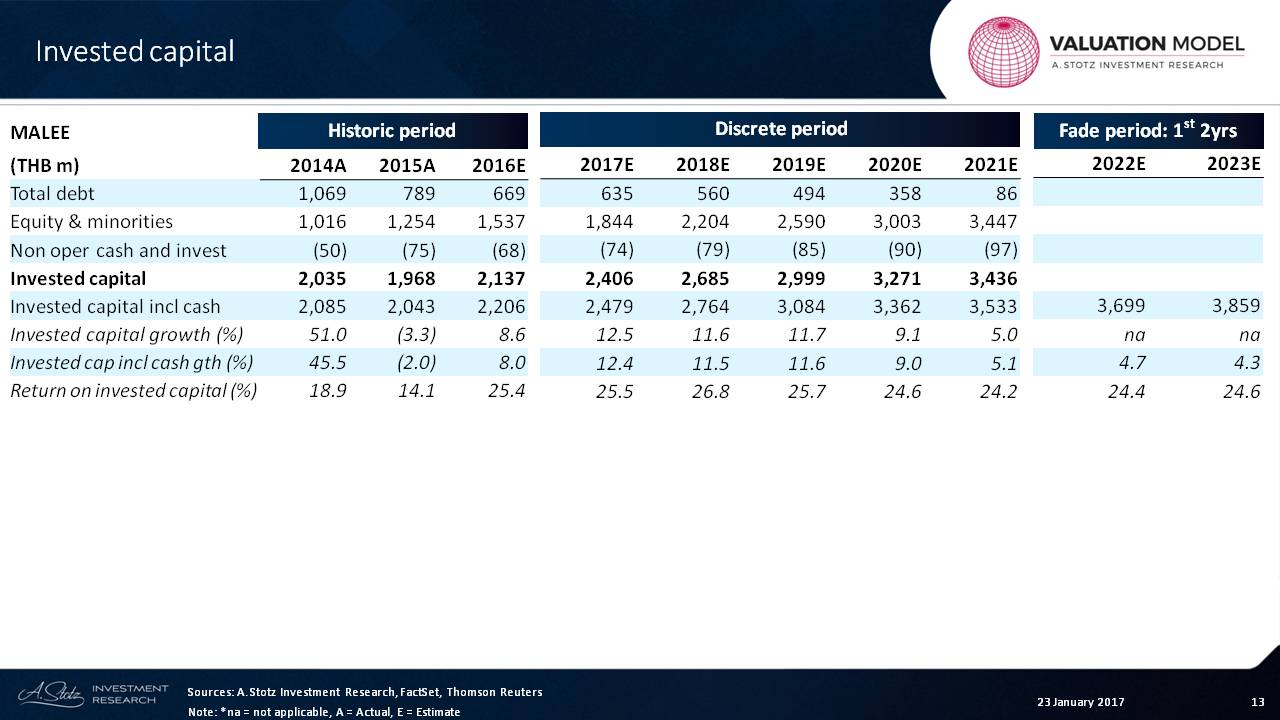
What we can see is that growth in invested capital is 5% to 10%. Basically, what we can then see is that the return on invested capital is about 25% ─ not bad.
The fade period is where we’re fading down the profitability to go back to normal.
Per Share
Let’s look at the final thing which is the per share data that we need for the dividend discount model.
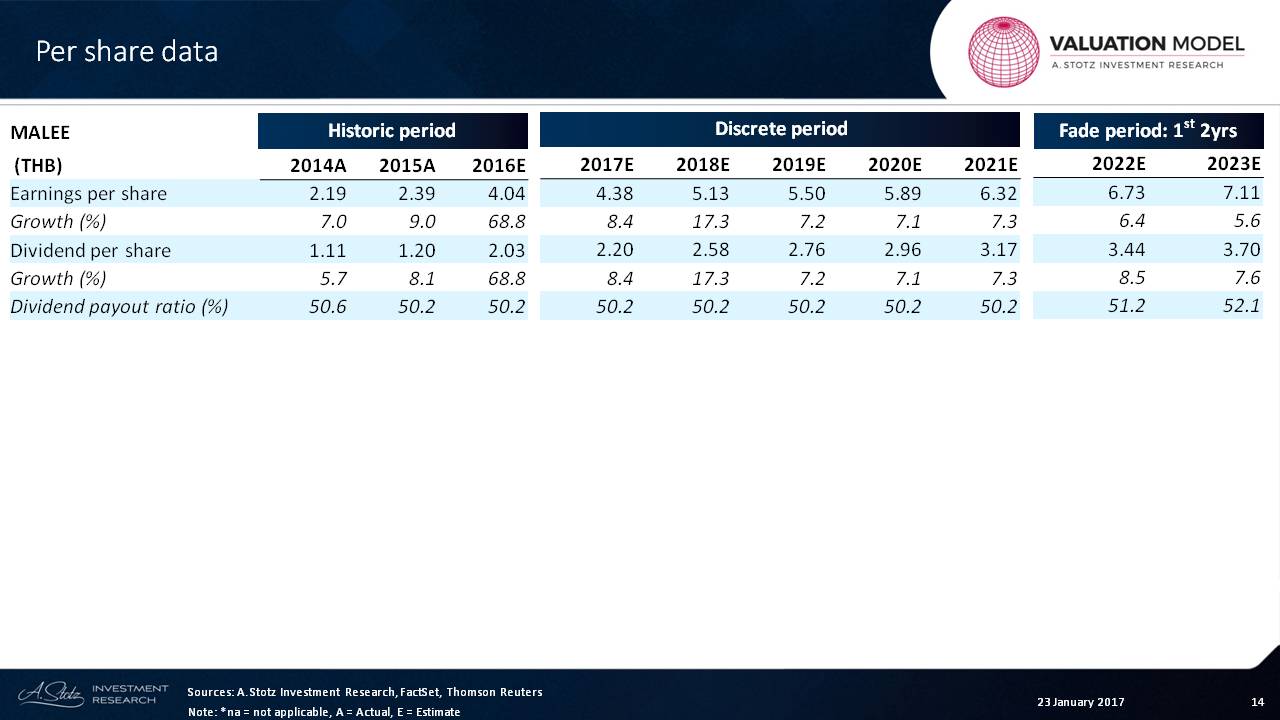
And so, we start with the EPS. The company has been growing its EPS extremely strongly. We can see about a 70% growth rate.
With that strong of a growth rate, it’s unlikely to repeat itself, so we’re going to keep growth relatively stable.
What we can also see is that the payout ratio is stable at about 50%. That means that the growth and dividend is going to match the growth in EPS. Those two are generally going to match if dividend payout ratio stays the same.
Cost of Capital
Now, let’s move on to the cost of capital.
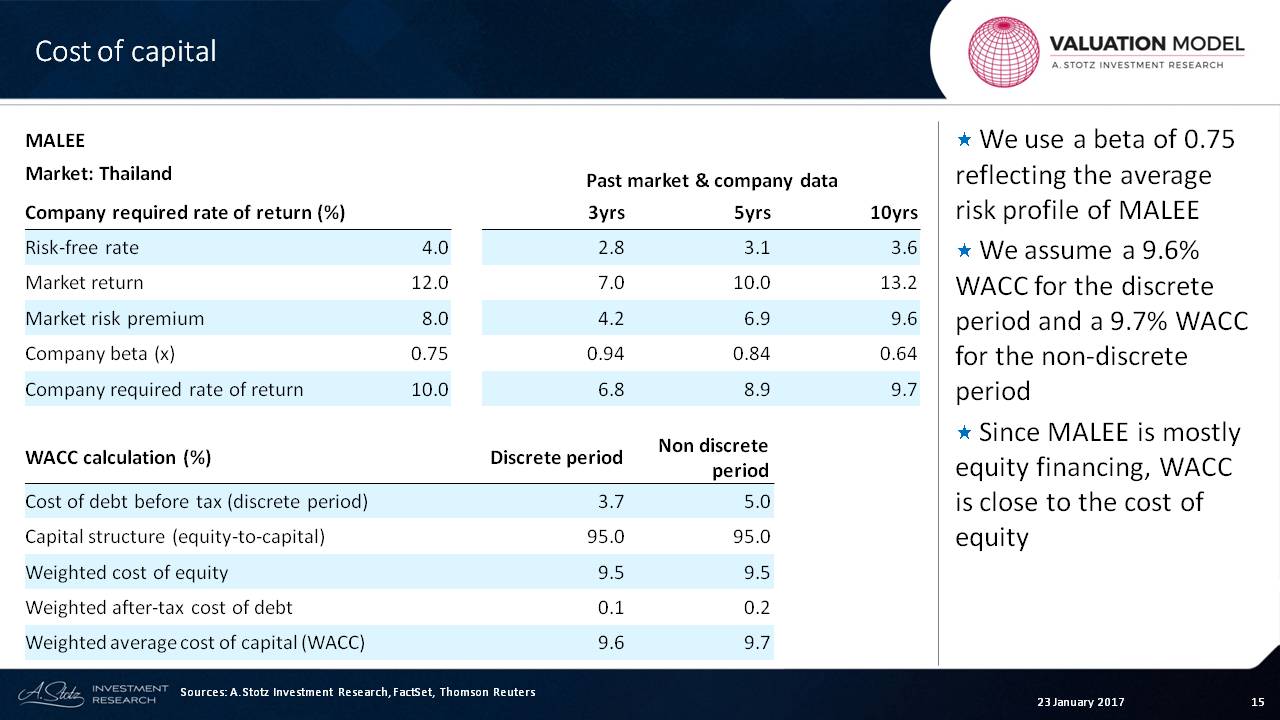
For Thailand, we assume a risk-free rate of about 4%. With a market return of about 12%, the market premium sits at about 8%.
Those are the numbers that we’re assuming for Thailand. Of course, those could be very wrong or they could change. But let’s use that across all the companies. I think the important thing is that these things stay the same by country, depending on what your forecast is or what your expectations are.
Now, the next thing we can do is look at the beta over a three-year, five-year or ten-year period. And we can see that it’s a low to moderate beta stock.
Therefore, we use 0.75. The 0.75 is kind of a go-to number, if it’s low. And it’s based upon research that we’ve done about the convergence, the reversion to the mean or the reversion of high or low beta stocks, so we try to keep it in a tight range around 1.0.
That gives us a required rate of return of about 10%.
Basically, the company funds almost all of its capital structure through equity. So the weighted average cost of capital is almost equal to the cost of equity because the level of debt is very low.
Terminal Factors
Let’s talk about terminal growth.
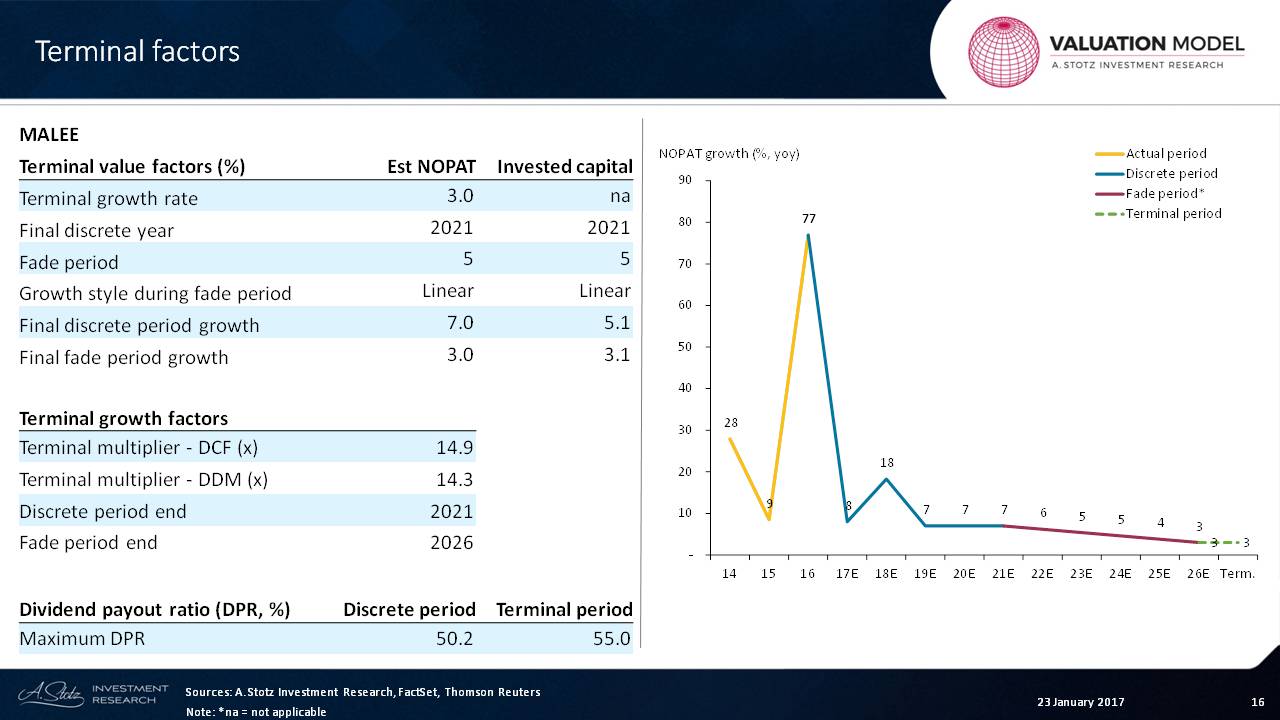
The assumption that we’ve got is about 3%. Our final discrete year is 2021.
We have a fade period where we’re fading down five years. That fade period is the red line.
Now, we also use multipliers. This is the multiplier that we use for the Gordon Growth or the Constant Growth Model for the terminal period, which is about 14 to 15x. And that’s how we get the terminal value, which is based upon this going forward.
Absolute Valuation
Finally, let’s move on to the valuation that we get from that, and you can see the DDM valuation. Remember that there are three components to this: this is our discrete period where we’re forecasting. This is our fade period and then the terminal value.
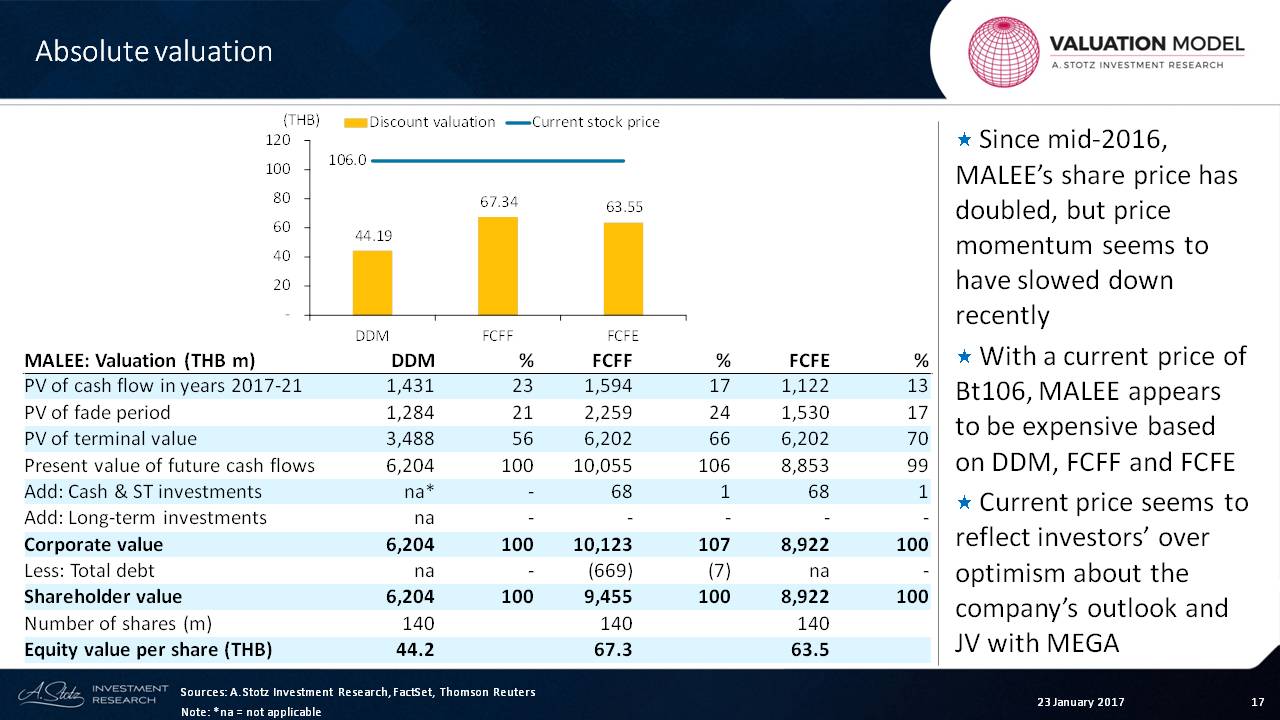
We can see that about 23% on the dividend discount model comes from this discrete period that we are forecasting. The fade is about 21%. And then, 56% comes from the terminal value.
Many analysts will look at these and do the same. In other words, they may forecast for five years, and then they just do a terminal value.
So we can say that 23% is in the discrete period, and roughly 7% is in the terminal period.
We like to do the fade period, because that just gives us a more accurate number.
When we do the free cash flow to the firm and free cash flow to equity, we can see that it changes a bit. We see 17%, and then down to 13% in the discrete period.
The end result: After we’ve added back cash and taken away debt, in particular, what we end up with is the equity value per share right here, which we can see ─ in every case ─ is much lower than the market price.
So it would appear from this that the company’s share price has a lot of optimism in it, unless we are wrong in our forecast and valuation.
Relative Valuation
Now, let’s look at the valuation relative to the consumer sector.
What we can see here is that the PE ratio is about 24x. That’s about in line with Thailand, a little bit more expensive than Asia ex-Japan, and a little bit more expensive than the world.
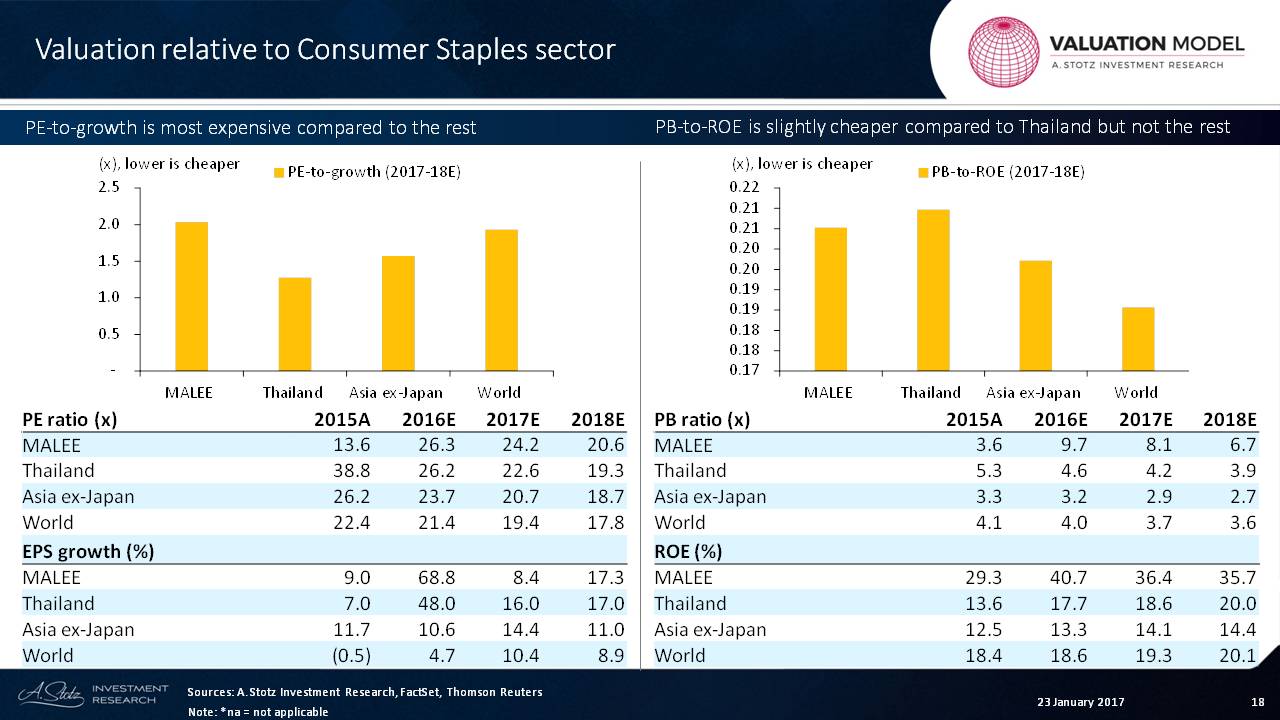
Then it’s a question of what level of growth. If we’re paying 24x in PE, what level of growth do we get?
When we look at this, we can see on the upper, left that lower is cheaper. And so, this company is more expensive than almost every other consumer staple sector in Thailand, Asia ex-Japan or the world.
And if we look over here, we can see that the price-to-book ratio is pretty high relative to Thailand. However, what we can also see is that the ROE is very high relative to Thailand and Asia ex-Japan.
Yes, it’s still expensive relative to Asia or to the world. But relative to Thailand, we can say that it’s a little bit cheap ─ though not by much.
So when we look at it from a free cash flow basis, we can see that it’s expensive. And when we look from this basis, it’s basically a little bit expensive or possibly only slightly cheap or in line with the market.
Sensitivity Analysis
Finally, let’s just look at the four sensitivities that we should look at: sales, gross margin, discount rate and terminal growth rate.
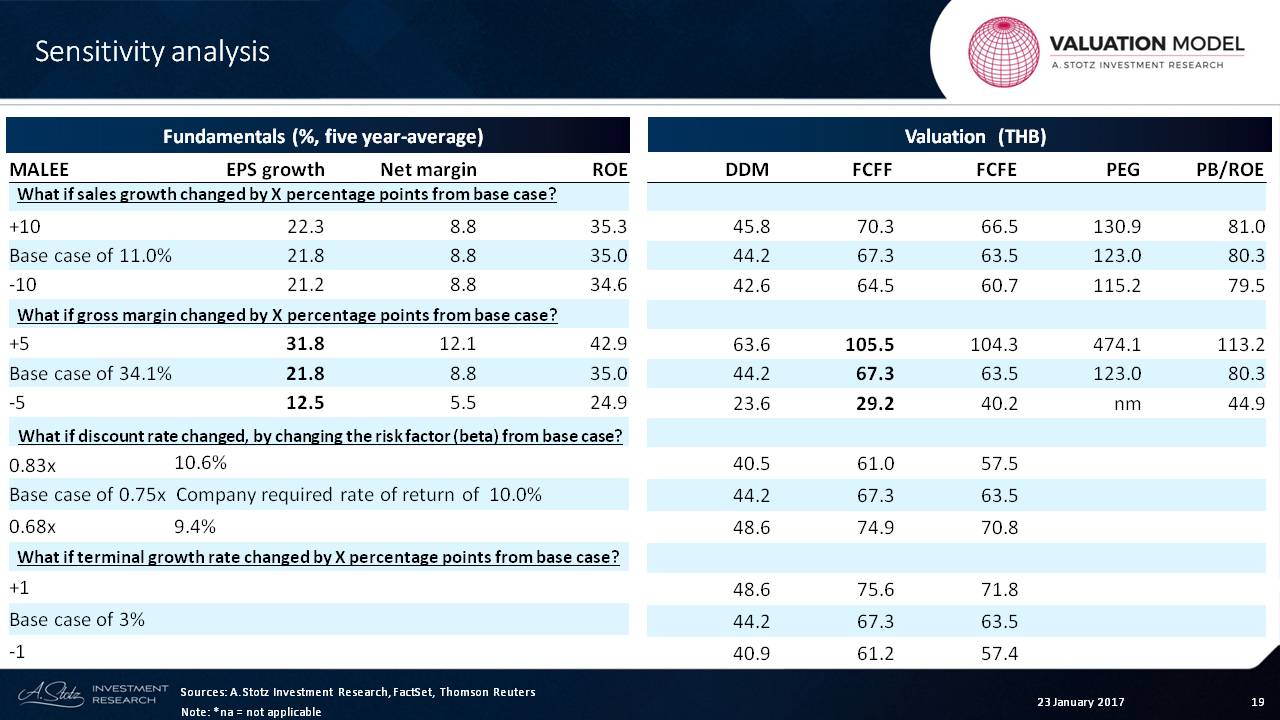
Let’s just focus in on this one right here and we can see that the sensitivity to the gross margin is where you get the biggest bang for your buck.
If the company was able to move its gross margin from 34% to 39% by increasing it by 5%, that would cause EPS to go from 21% to 31.8%.
But if the company saw that its gross margin fell ─ in this case by 5% ─ that’s going to bring the EPS down to 12.5%.
So there’s a lot of sensitivity there.
And then, we can also see the impact of that in the valuation. We can see that there’s a lot of sensitivity on the free cash flow to the firm and free cash flow to equity.
That wraps it up for Malee, and you can get a picture that the company appears to be a little bit expensive.
Check out the World Class Benchmarking of Malee Group
Have you got any questions?
Just leave a comment and we’ll try to answer it.