Higher COGS in China Compared to the Rest of the World
We have combined the financial statements of China-listed non-financial companies into one for the past 23 years. The average number of companies included in this study was 1,981 per year and as of 2017, it was 2,777.
China’s gross profit margin has been 4 ppts below the global average
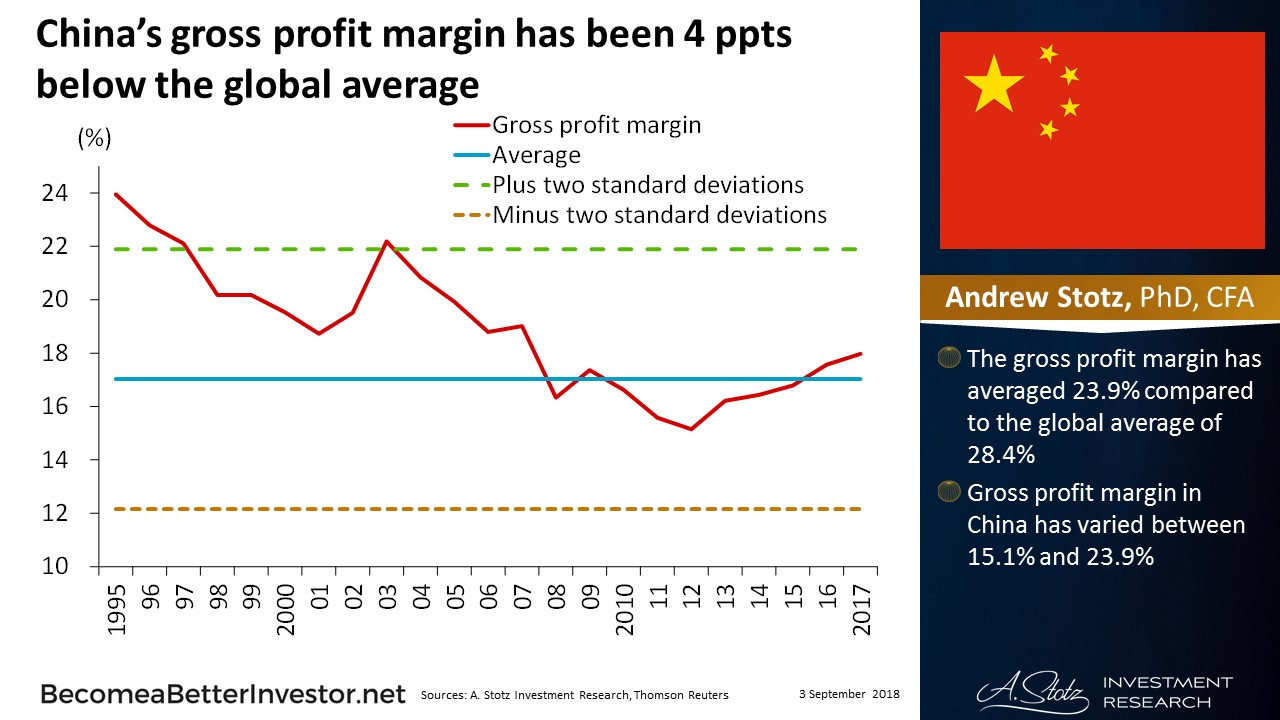
- The gross profit margin has averaged 23.9% in China compared to the global average of 28.4%
- Gross profit margin in China has varied between 15.1% and 23.9%
China’s net profit margin has been on par with the global average
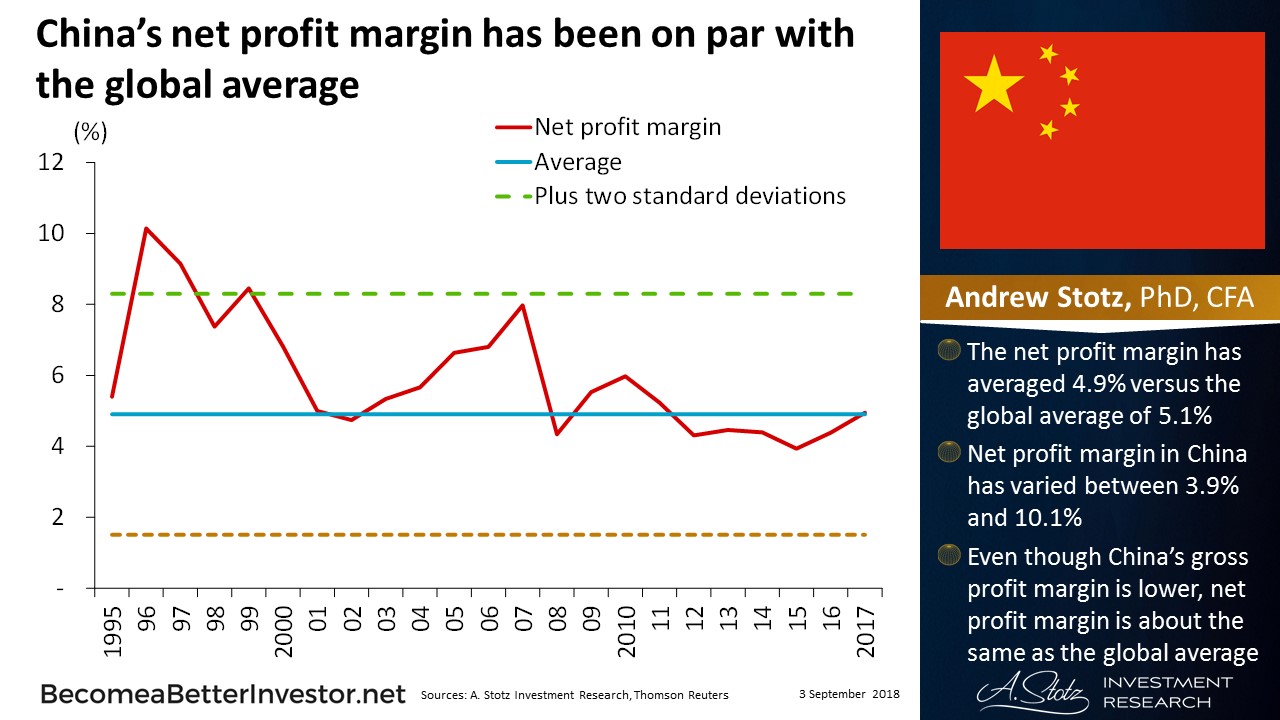
- The net profit margin has averaged 4.9% versus the global average of 5.1%
- Net profit margin in China has varied between 3.9% and 10.1%
- Even though China’s gross profit margin is lower, the net profit margin is about the same as the global average
- Implying that China has higher COGS but lower SG&A and other costs than firms globally
Asset turnover in China has been slightly lower compared to the global average
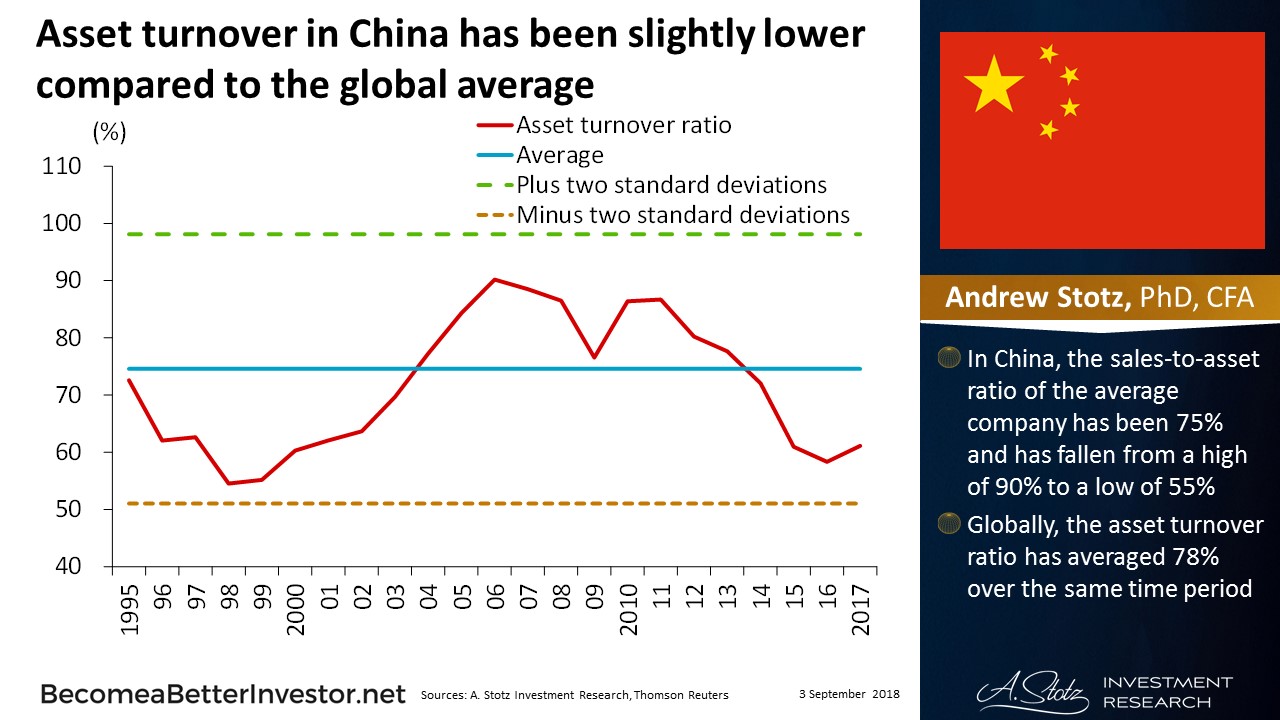
- In China, the sales-to-asset ratio of the average company has been 75% and has fallen from a high of 90% to a low of 55%
- Globally, the asset turnover ratio has averaged 78% over the same time period
DISCLAIMER: This content is for information purposes only. It is not intended to be investment advice. Readers should not consider statements made by the author(s) as formal recommendations and should consult their financial advisor before making any investment decisions. While the information provided is believed to be accurate, it may include errors or inaccuracies. The author(s) cannot be held liable for any actions taken as a result of reading this article.