VMC: The Relationship Between the Yield Curve And the Stock Market
This is a Valuation Master Class student essay by Teeradon Piyakiattisuk from May 9, 2019. Teeradon wrote this essay in Module 3 and has since completed all five modules of the Valuation Master Class. The post was originally published here.
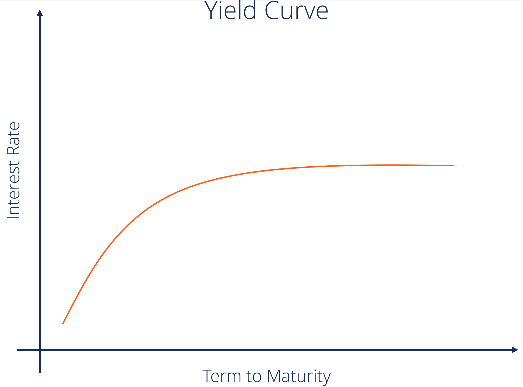
The yield curve is a line that plots the bond yields at a set point in time, of bonds having equal credit quality against their maturities. The curve shows the relation between the interest rate and the time to maturity. Typically, bond maturities vary from 3 months to 30 years.
The yield curve reflects investor expectations of future interest rates at any point in time. The short-term bonds (also called the short end) tend to be influenced by market participants’ view of what the central bank is going to do in the future or expectations for central bank policy. On the other hand, the long-term bonds (also called the long end) are influenced by macroeconomic factors such as business cycle, budget deficits or surpluses and inflation. There are also other variables for specific bonds such as call provisions.
Shapes of the yield curve
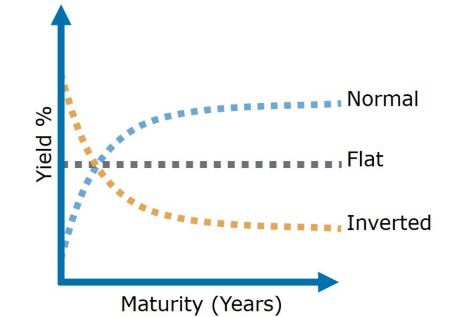
The yield curve is always changing based on shifts in market conditions. In general, the yield curve can be separated into 3 shapes.
- Normal yield curve
is the most common type of yield curve. As we can see the blue dotted line, a normal yield curve slopes upwards. The line starts with low yields for lower maturity bonds and then increases for bonds with higher maturity. Typically, longer maturity bonds usually have a higher yield to maturity to compensate for greater risks. The higher maturity, the more the curve becomes flattened. The normal yield curve implies a stable economic condition.
- Invert yield curve
is an abnormal situation and happens when the yields on the short maturity bonds are higher than the yields on the longer maturity bonds. This situation occurs because investors have little confidence in the near-term economy. Therefore, they demand higher yields for short-term investments than longer-term investments to compensate for the uncertainty.
- Flat yield curve
short maturity bonds have yield to maturity which are similar to the longer maturity bonds. It implies an uncertain economic condition that includes high inflation and fears of a slowdown, or an expectation that an interest rate is expected to increase. The investors become indifferent to the maturity of the bonds and demand a similar yield across all maturities.
The yield curve as a leading indicator of the stock market
The yield curve is generally indicative of future interest rates, which indicates an economy’s expansion or contraction, particularly inflation. Inflation usually comes from strong economic growth. The bond yields will increase to offset the effect of inflation. Usually, investors look at the spread between the 3-month rate bill and the 10-year note. The short end reflects the interest rate which is set by the central bank. The long end is set by market conditions. Therefore, the short end is the primary determinant of its curve. In other words, the curve steepness depends mainly on the central bank’s decision on lowering or raising the policy rate. Therefore, the yield curve reflects the economy’s prospects in which the central bank is aiming to stimulate the economy by lowing the interest rate or raising the policy rate to tighten it.
A history of the inverted yield curve
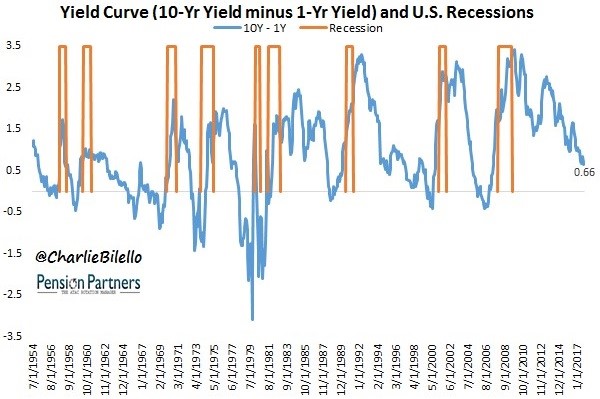
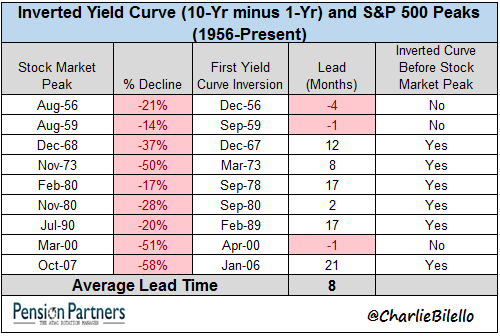
Investors usually look at the spread between 10-year yields and the short end yields such as 3-month, 1-year or 2-year bonds. Based on S&P500, during the period from 1956 to the present, the inversion of the yield curve occurred 9 times. There were 6 times that the yield curve inverted before the stock market had reached its peak. The inversion also occurred 3 times after the stock market had declined. This can imply that the inverted yield curve is not always the leading indicator. However, it is not always the case. In 2011, S&P500 had declined without the inverted yield curve. As the stock market is the economy, it can decline because of investors’ sentiment.
Conclusion
The evidence shows the fact that the yield curve is not always the case as a leading indicator of the economy. The inverted yield curve also does not imply the stock market is going down in the near term. However, in the short run, the inverted yield curve reflects the market participants’ perspectives on the economy and the central bank’s policy to stabilize the economy. At least, it can tell that the economy is in a vulnerable position.
References
https://seekingalpha.com/article/4164973-relationship-yield-curve-stock-market
Join the Bootcamp for Valuation!
The Valuation Master Class is the complete, proven, step-by-step course to guide you from novice to valuation expert.
Save US$50 with coupon code: get-smarter
Click here to learn more and register.
DISCLAIMER: This content is for information purposes only. It is not intended to be investment advice. Readers should not consider statements made by the author(s) as formal recommendations and should consult their financial advisor before making any investment decisions. While the information provided is believed to be accurate, it may include errors or inaccuracies. The author(s) cannot be held liable for any actions taken as a result of reading this article.


