Lower Paybacks Show Higher Future Return
Share buybacks have been hotly debated over the past few years. Following the debate, there have been financial discussions, but also many political debates. Let’s take a look at some commonly raised views raised in the buyback debate before we take a look at the data.
Proponents of share buybacks
Manconi et al. (2019), looked at returns over a 4-year period following share buyback announcements and concluded it leads to excess long-term returns. Two Sigma’s study concluded that buybacks don’t appear to “artificially suppressing market volatility or requiring companies to forgo otherwise profitable investments or take on excess leverage.” Though, they found evidence supporting the conclusions drawn by Manconi et al.
Buybacks aren’t coming at the expense of investment it’s about large, mature companies returning cash to shareholders which allow cash to be put to more productive uses. “It’s not that companies are investing less, it’s that different companies—with better growth opportunities—are investing instead.”
Critics of share buybacks
Buybacks are made by management to maximize short-term compensation at the expense of long-term investments that would maximize shareholder value. Rather than buying back shares and making shareholders richer, companies should pay their workers higher wages.
William Lazonick, professor at the University of Massachusetts, means that buybacks are returning cash to shareholders at the expense of investment which harms innovation and workers.
Our study isn’t only focused on share buybacks but we set out to investigate if companies that pay back a large share of their earnings or cash flows have a strong share price performance. Read this for a deeper discussion of what share buybacks are and how it can impact companies.
Paybacks-to-net income currently close to peak levels in the US
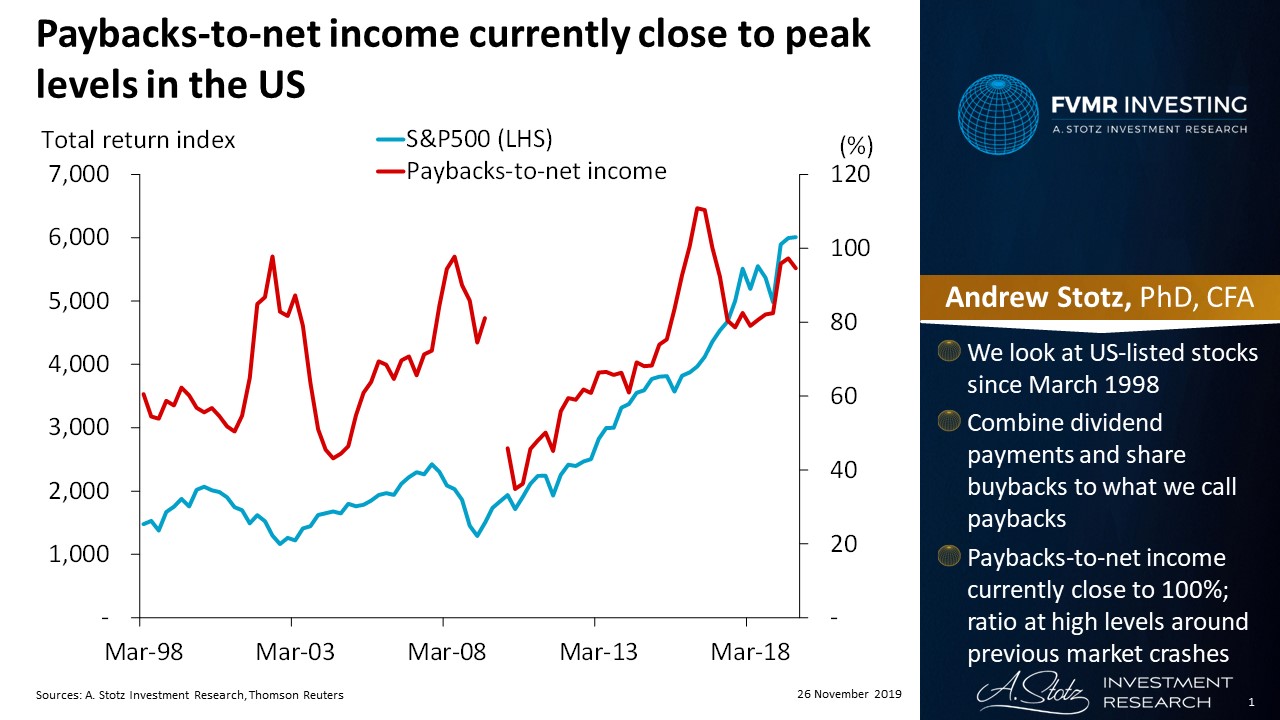
We look at US-listed stocks since March 1998 and combine dividend payments and share buybacks to what we call paybacks. Paybacks-to-net income currently close to 100%; ratio at high levels around previous market crashes.
Highest Paybacks-to-net income had the poorest return
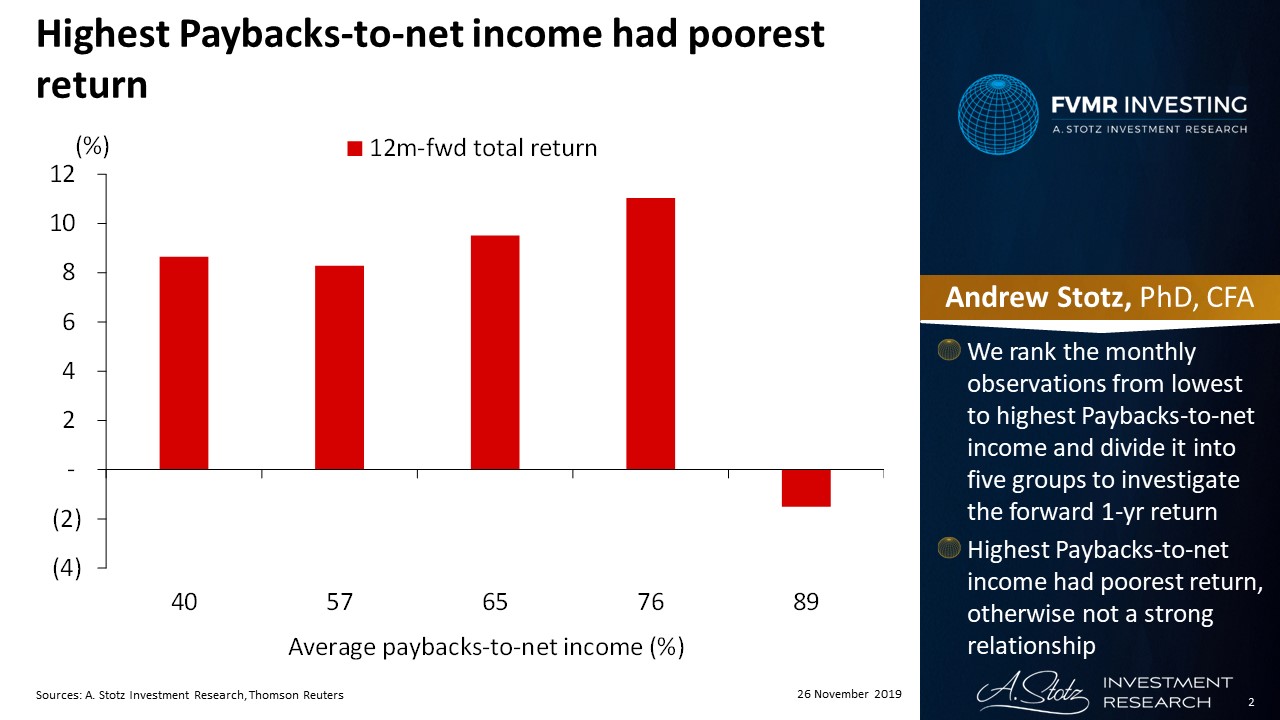
We rank the monthly observations from lowest to highest Paybacks-to-net income and divide it into five groups to investigate the forward one-year return. Highest Paybacks-to-net income had the poorest return, otherwise not a strong relationship.
Paybacks-to-FCF well below the levels seen before the Global Financial Crisis
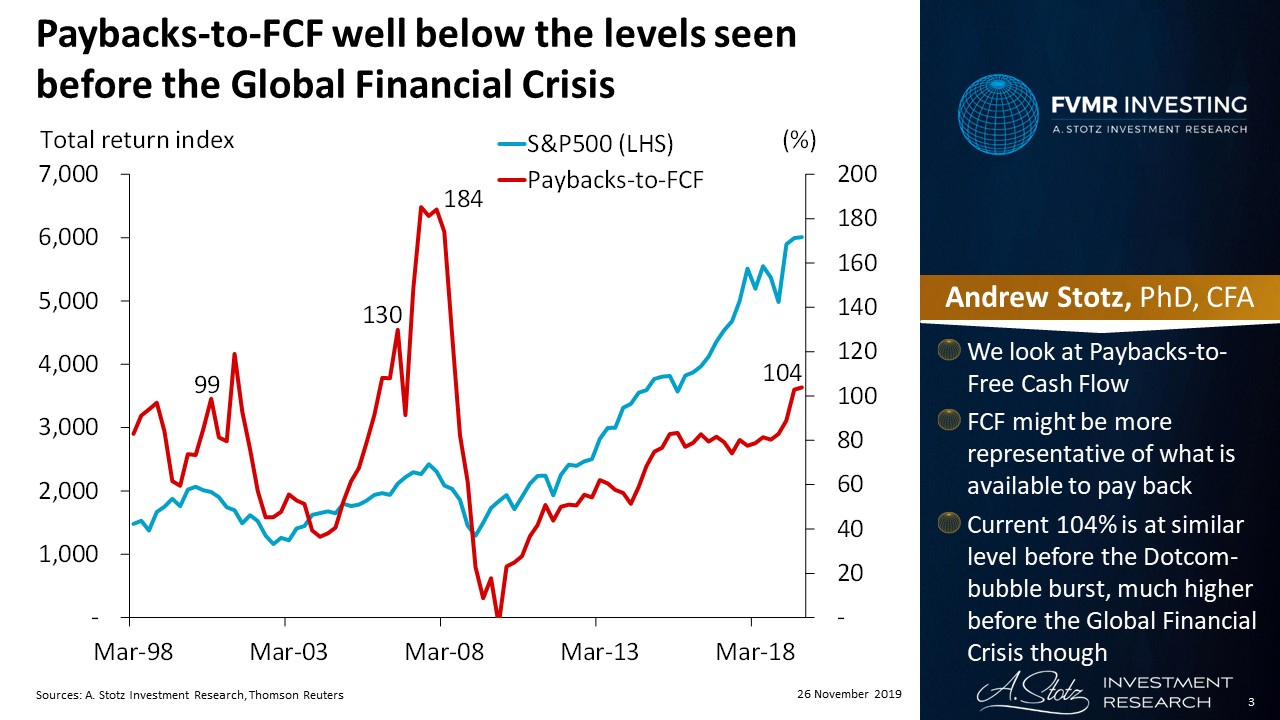
We look at Paybacks-to-Free Cash Flow (FCF). FCF might be more representative of what is available to pay back. The current 104% is at a similar level as before the Dotcom-bubble burst, much higher before the Global Financial Crisis though.
Buying at times of lower Paybacks-to-FCF has shown higher forward return
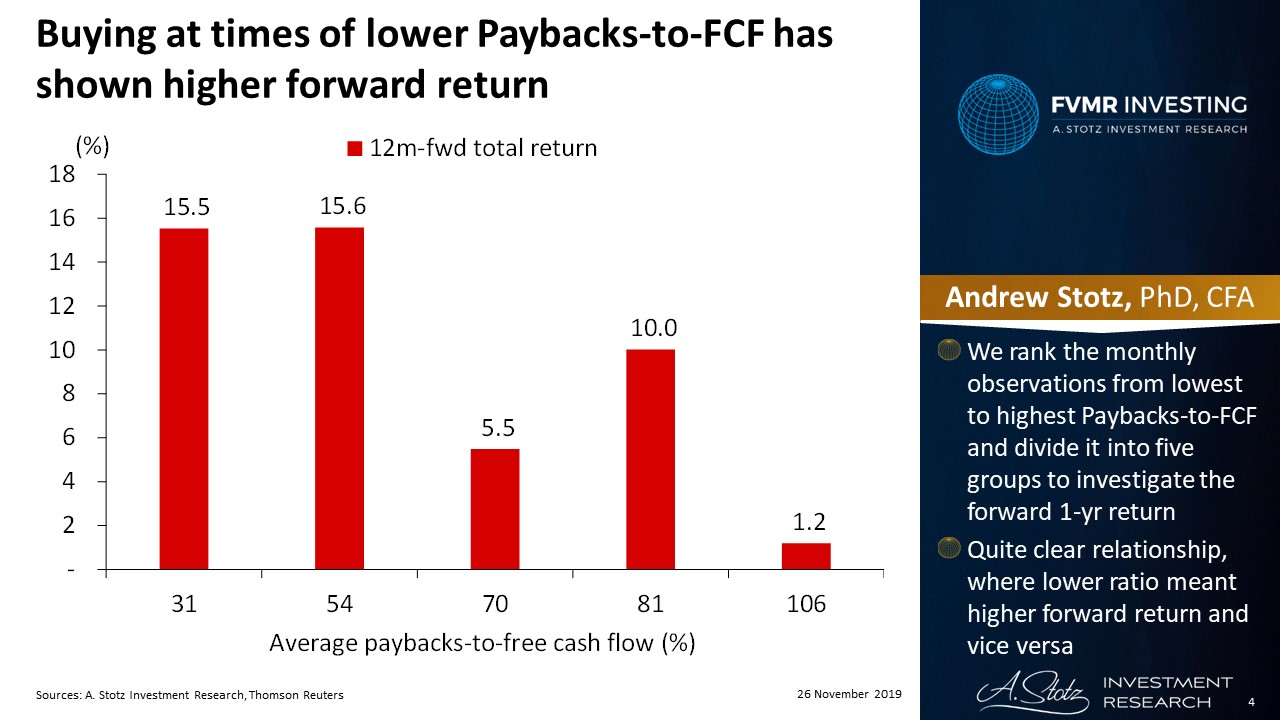
We rank the monthly observations from lowest to highest Paybacks-to-FCF and divide it into five groups to investigate the forward one-year return. Quite a clear relationship, where lower ratio meant higher forward return and vice versa.
Capex spending has been lower in recent years
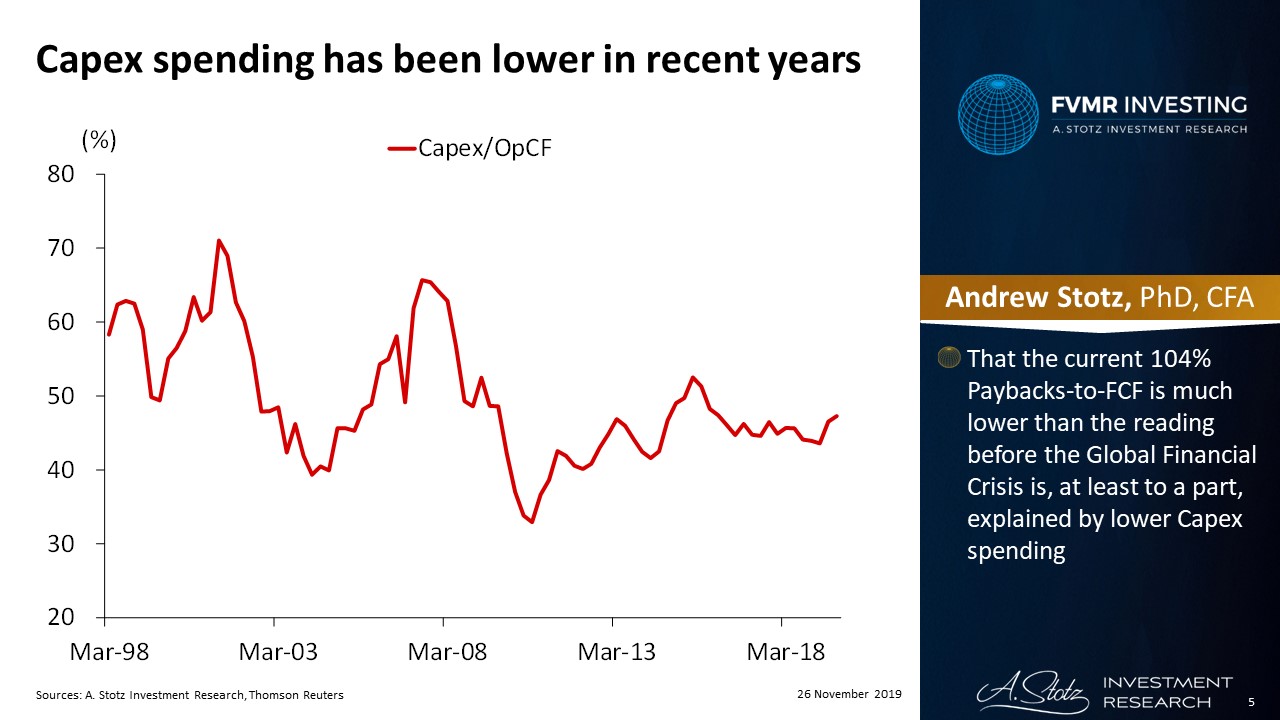
That the current 104% Paybacks-to-FCF is much lower than the reading before the Global Financial Crisis is, at least to a part, explained by lower Capex spending.
Discussion
Our results show that a lower Paybacks-to-FCF resulted in a higher forward one-year return. One difference in our study compared to other studies is that we looked at the financial data of the companies to identify paybacks, hence, when buybacks and dividend payments have occurred rather than when they were announced.
The results could be interpreted as companies that pay back a significant part to shareholders have few investment and therefore growth opportunities. Paybacks haven’t necessarily been a bad allocation of capital recently, though, as the asset efficiency of companies has been in a downward trend.
DISCLAIMER: This content is for information purposes only. It is not intended to be investment advice. Readers should not consider statements made by the author(s) as formal recommendations and should consult their financial advisor before making any investment decisions. While the information provided is believed to be accurate, it may include errors or inaccuracies. The author(s) cannot be held liable for any actions taken as a result of reading this article.