Increased Correlation But Stock Pickers Can Still Diversify
Watch the video with Andrew Stotz or read the research below.
Let’s review the academic-style research format we use at A. Stotz Investment Research. We start with a question. Then we review prior research, develop a hypothesis, select the data set, develop our method, and test and find the results. Finally, most importantly, is to advise on how to apply this to improve investment decisions—action.
Question
- What benefit can you get from diversification? When I think about diversification, I’m thinking about it:
- Across the three major asset classes
- Across emerging and developed markets
- Across the ten major sectors
- Across countries
- Across stocks
- Does it add more or less diversification benefit now compared to the past?
Review
Kose, Otrok, and Prasad, was written in 2008; and the conclusion was mixed. They investigated the degree of global cyclical interdependence between 1960 and 2005. They looked at three groups: industrial economies, emerging markets, and other developing economies.
They concluded that business cycles within the groups had converged but became less synchronized between industrial economies and emerging markets. So the results were mixed.
In 2009, Frank and Hesse found high correlation between emerging markets’ and developed markets’ assets. They investigated links between banks in developed countries and emerging market bond, stock, and credit markets during the 2008 global financial crisis.
There was no decoupling at the time of crisis. Liquidity and bank solvency measures had become more correlated with emerging market bond, stock, and credit markets during that crisis period. So markets are highly correlated.
Wälti (2012), rejects decoupling. He looked at deviations from GDP trends rather than the actual GDP growth rates; and he looked at 1980 to 2008.
Wälti rejected decoupling in the years before the global financial crisis and concluded that the business cycle interdependence had become stronger. So they’re highly correlated.
In 2012, research by Yeyati and Williams rejected financial decoupling. They tested decoupling in two ways from 1993 to 2010. They looked at real decoupling which they called “sensitivity to business cycles and other economic factors such as GDP” and financial decoupling which was “sensitivity of emerging market assets (credit, equity, and foreign exchange returns) relative to a global market portfolio.”
They concluded that business cycles in emerging markets have gradually decoupled from developed markets. They rejected financial decoupling as they could see high and increased “co-movement” in emerging market assets. The conclusion was that the markets were highly correlated.
Wyrobek and Stańczy came in 2013. This one looked specifically at Poland and found high correlation between emerging markets and developed markets. They looked at the U.S. and Poland and the GDP growth rate dependency on the underlying long-term GDP trend; and they compared deviations from that long-term GDP trend.
There was no evidence to support decoupling within the Polish economy and it was well synchronized with that of the U.S. So they were highly correlated.
Hypothesis
- There are diversification benefits due to a relatively low level of correlation to gain from investing in different asset classes such as regions, sectors, countries and stocks.
- Correlations will have increased over time in all of the above cases.
Data
First, we collected price data for MSCI indices from December 1994 to September 2015. Next, we looked at indices for bonds, commodities, and world equity. After that, we looked for equity indices for developed markets, emerging markets, global sectors, and countries.
For the company-level correlations, we used a data set of about 27,000 companies listed anywhere in the world beginning in March 2002 and ending in May 2015.
Results
Let’s look at the results. The first is that correlation increased after the global financial crisis. Now, we can see a pairwise 3-asset correlation of bonds, equity, and commodities and the correlation has been rising from 14% up to 45%. Diversifying across asset classes still offers benefits because diversification or correlation is still relatively low but it’s not as low as it used to be; and therefore, lesser benefits.
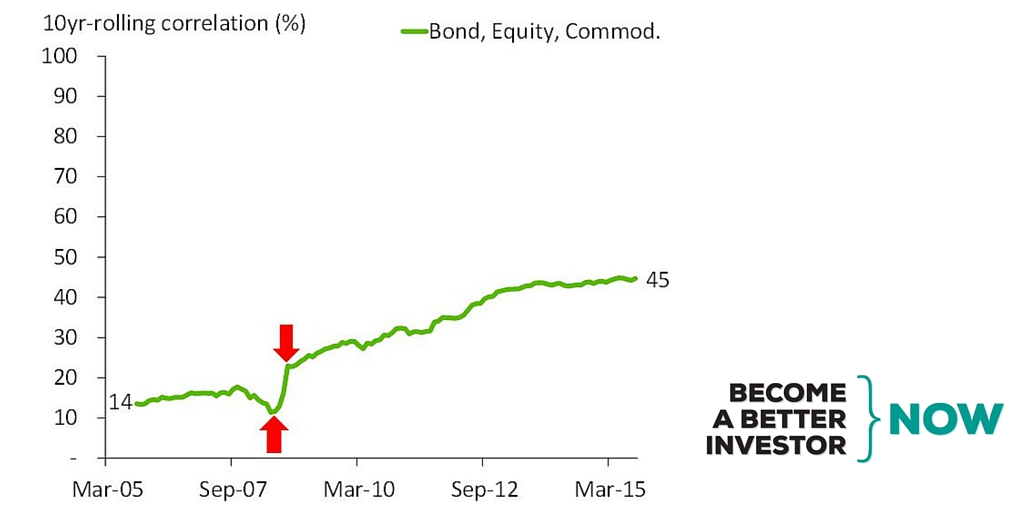
You see that little dip in the chart. Let’s investigate that further. First, we find the correlation was low during the stock market rise. So when the market was going up by almost 50% which peaked in October 2007, the bond market wasn’t going anywhere; so we can see correlation falling. Of course, that’s not correlation that we would like. I would rather have my assets go up on the upside but not on the downside. But that’s very hard to get.
Now, let’s look at the next area which is here (the second red arrow above).Correlation switched to very high and rising by February ’09 which was the equity trough. What we can see here is that the correlation was low just before the crash but it started to rise after the crash at the bottom of the market.
Let’s look at a couple of other asset classes.
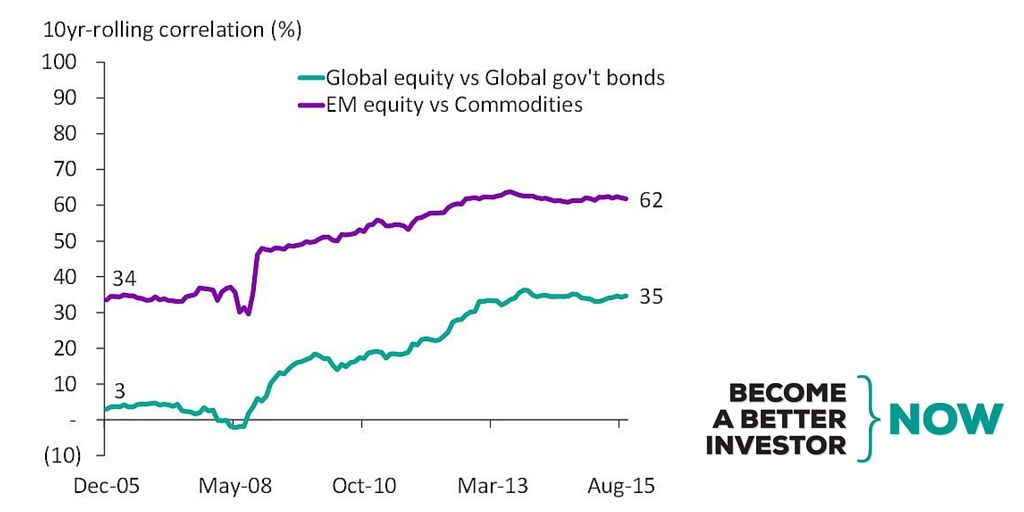
First, we can see that equity and bonds are no longer uncorrelated. The correlation between global equity and global government bonds has increased to 35% from 3% which is almost no correlation. Equity and bond correlations have shifted up; and the correlation between emerging markets and commodities has doubled to 62% from 34%.
I’m interested in this correlation mainly because emerging markets are tied to the commodity cycle such as coal and oil usage. So we see no major decoupling here.
Correlation increased after the global financial crisis. What we can see is that correlation between emerging markets and developed market equity markets has increased slightly to 87% from 77%. So if we go up to the highest level which is developed versus emerging markets which includes all countries and all stocks, we can see now that there’s a very high level of correlation; and there was a pretty high level in the past at 77%.
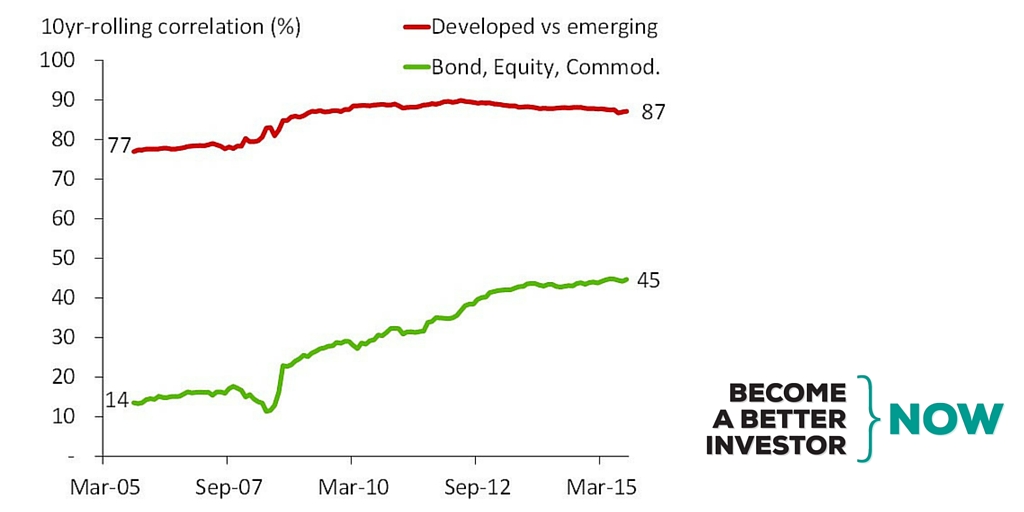
This implies increased financial integration and fewer benefits from diversification between emerging markets and developed markets if you’re looking at blending an emerging market index with a developed market index. They’ve always been highly correlated at this aggregate level so there’s no decoupling there.
Let’s look at the next one which is across sectors, and this has increased massively.
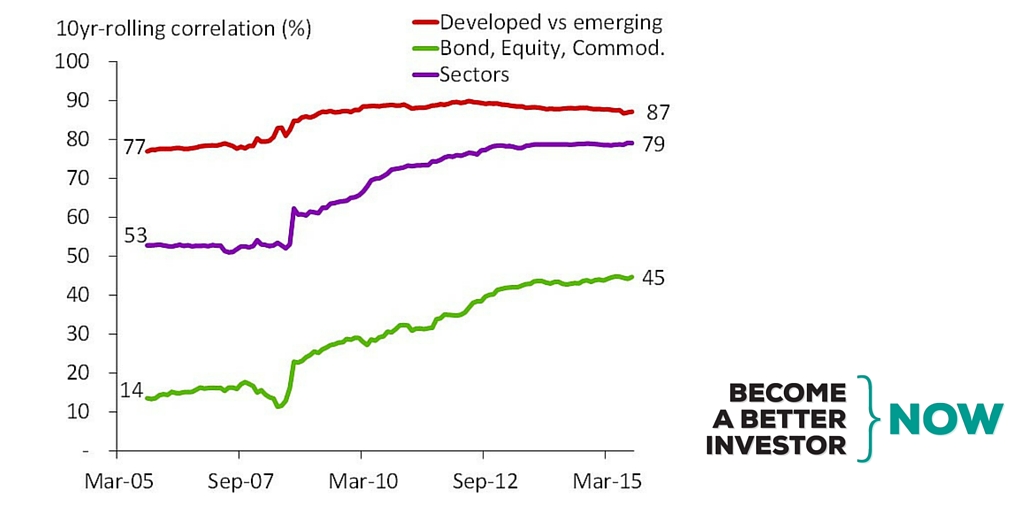
The average correlation among the ten major global sectors has risen to 79% from 53%. Diversification benefits across sectors have been drastically reduced since the crisis, and that’s because this chart is moving up and they’re becoming more correlated.
Next, let’s look at country-level diversification and see that it still offers benefits.
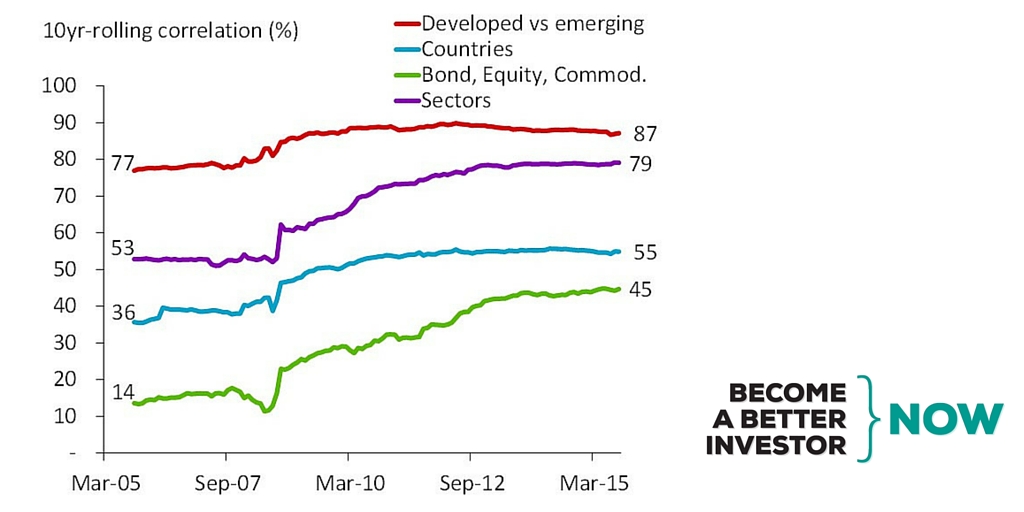
What we can see is that the average correlation across countries has increased from 36% to 55%. But at the country level, it’s easier to benefit from diversification even though correlation has increased. So there’s no decoupling.
The next chart is the one that I think is the most interesting, and that is stocks.
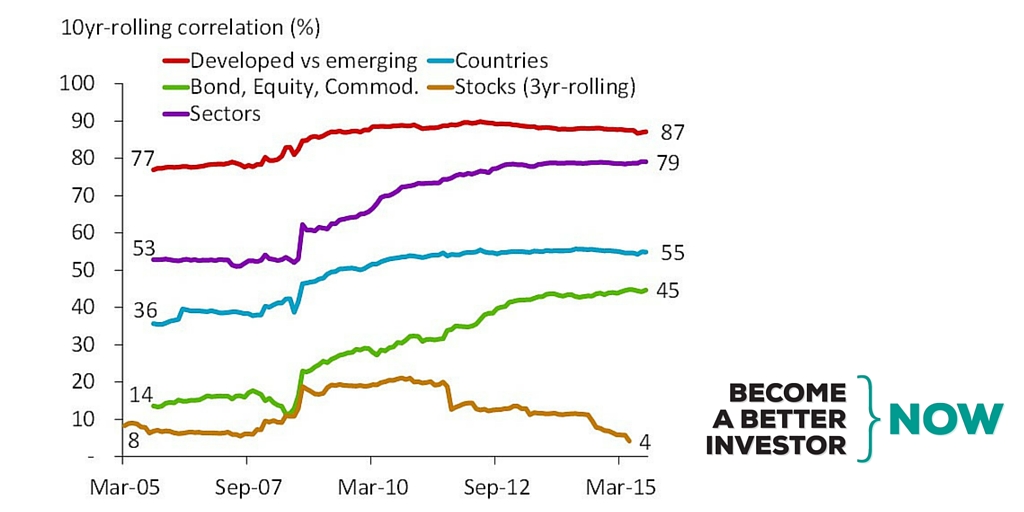
We can see that correlations are rising between markets and big industries, and things are becoming more correlated. But what we can also see at the stock level is this: Stock pickers can still diversify. The least amount of correlation exists between stocks. This is between your average stock.
Though correlation among stocks tripled during the financial crisis, it’s been decoupling since 2012. This means that a stock picker can still construct a highly diversified portfolio. So stocks have decoupled and they have remained decoupled.
Let’s summarize what we saw.
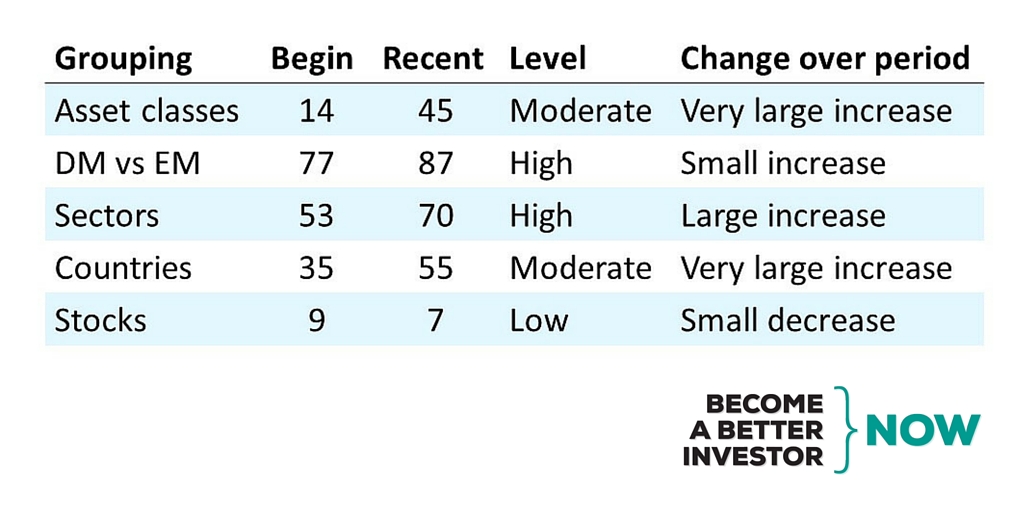
Asset classes have seen an increase to 45% correlation which we would say is moderately correlated but a very large increase.Developed markets versus emerging markets moved up to 87% but they have always been high and this is a small increase.
Sectors have moved significantly from a 53% to a 70% recent correlation. This is a high level of correlation and it’s been a large increase. Countries moved from 35% to 50% so it’s a very large increase and it’s a moderate level of correlation. Stocks moved from 9% to 7%, actually down, which is a low level and is a small decrease in correlation.
Action
- Correlation has increased over time except for individual stocks
- Expect portfolios of indices to be highly correlated
- Construct portfolios of stocks to benefit from decoupling
Do you consider correlation when investing? How do you use it? Did this post change the way you look at correlation?
We’d love to hear from you in a comment below.
Feel free to share this article with your friends.
DISCLAIMER: This content is for information purposes only. It is not intended to be investment advice. Readers should not consider statements made by the author(s) as formal recommendations and should consult their financial advisor before making any investment decisions. While the information provided is believed to be accurate, it may include errors or inaccuracies. The author(s) cannot be held liable for any actions taken as a result of reading this article.