Posts by Andrew Stotz
VMC: Mistake #4 – Confusing Growth Capex with Maintenance Capex

When it comes to choosing CFA or MBA, it’s important to check out what will be required of you to attain it in terms of time and study, and what competitive edge each qualification will give your career. Here is how each type of certification will help you advance your skills, so that you can decide which one is right for you.
Read MoreGlobal Revenue Growth May Be Getting Closer to a Peak
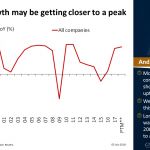
Chart of the Day: More than 17,000 companies worldwide have shown a strong revenue uptrend. We are now two years into this revenue uptrend and may be getting closer to a peak. Companies have been slow to expand their assets, unlike in prior stock market boom times.
Read MoreAsia ex Japan Is Trading around Its 10-yr Average Price-to-Book
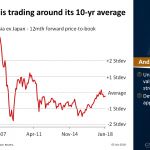
Chart of the Day: Global markets are expensive, not bubble yet. US 10-year bull run hitting its peak. Unlike the US, Asia valuations are not stretched. Developed Asia ex Japan appears cheap.
Read MoreVMC: How to Decide Between the CFA Program vs. an MBA Program
When it comes to choosing CFA or MBA, it’s important to check out what will be required of you to attain it in terms of time and study, and what competitive edge each qualification will give your career. Here is how each type of certification will help you advance your skills, so that you can decide which one is right for you.
Read MoreDeveloped Markets Have Rebounded Recently, Emerging Markets Have Not Followed
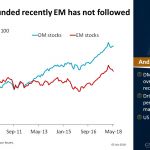
Chart of the Day: Developed markets have outperformed Emerging markets over the past decade and recently. Outperformance has been driven by the strong performance of the US market. US could be at risk, though.
Read MoreVMC: Mistake #3 – Growing Fixed Assets Slower than Revenue
When forecasting, a good rule of thumb is that fixed asset growth should roughly match revenue. We know that investment and fixed assets are generally lumpy. Read more here on how to avoid the common valuation mistake #3 here…
Read MoreVMC: One of the Biggest Influences on Your CFA Score: Personality
While becoming a CFA Charterholder is a fantastic honor, before you commit to spending all of your free time on studying, make sure that you have the determination to succeed.
Read MoreDividends Contributed Half the Return in Taiwan Since 2000
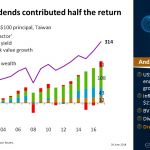
Chart of the Day: Dividend yield has consistently contributed to return in Taiwan. US$100 invested at year-end 2000 would have grown to US$314 and dividends contributed 50% of that gain.
Read MoreVMC: Mistake #2: Underestimating Expenses Causing Unrealistic Profit Forecasts
For additional growth, a company needs to invest more than just maintenance Capex. While growth Capex has much more volatility, it is essentially the key to the future success of a company. Discover how to avoid confusing the two here.
Read MoreVMC: Improve Your CFA Exam Score
Just because you know that the CFA exam is going to be tough, that doesn’t mean there aren’t tips you can implement to help boost your chances of improving your CFA score. Read them here.
Read More