VMC: Mistake #3 – Growing Fixed Assets Slower than Revenue

This post was originally published here.
Today, let’s talk about mistake #3: Growing fixed assets slower than revenue.
First though, a quick recap of the full list of Top 9 Mistakes.
The Top 9 Valuation Mistakes
- Overly optimistic revenue forecasts
- Underestimating expenses causing unrealistic profit forecasts
- Growing fixed assets slower than revenue
- Confusing growth with maintenance Capex
- Forecasting drastic changes in cash conversion cycle
- Underestimating working capital investment
- Valuing a stock using the calculated Beta
- Choosing an unreasonable cost of equity
- Not properly fading the return on invested capital

Now, gather round the fire. I’m going to tell you a true campfire story, though I’ve adapted some elements slightly to make it a bit easier to understand. This is a tale about what an analyst came to me with when they were getting ready to publish a report and I was the Head of Research.
On a sunny afternoon in 2016, the analyst presented me with their cash flow data, see Fig. 1 below. What I could see is what I call “basic cash flow.” It’s just the net operating profit plus depreciation and amortization. What we can see from the table is a slight double-digit growth and in 2021, a slightly forecasted high at 16%.
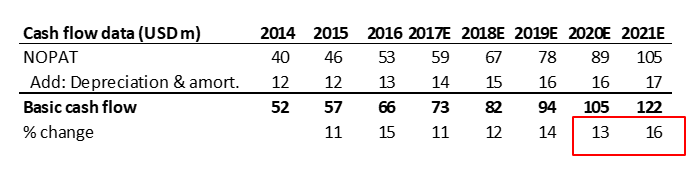
Fig. 1 Cash Flow Data
Of course, you need to think about assumptions in the final years because if they’re really high, then we’re going to carry on that high profitability or free cash flow valuations to infinity. And that could cause us to inflate the terminal value.
Let’s look at the next part that he presented. What he showed me was the Capex, see Fig. 2 below. The Capex in the first forecasted year, 2017, was 29; in the second forecasted year of 2018, it was 32; in the third forecasted year of 2019, it was 35.
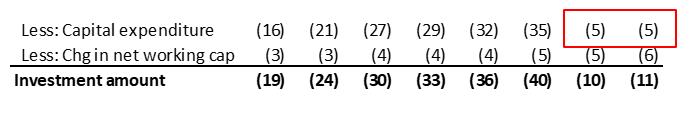
Fig. 2 Capital Expenditure
When we got to the fourth and the fifth years, what he showed me was that it went to five. Five! Wow!
So, the investment amount of the overall company dropped dramatically in those periods accordingly (Fig. 3).
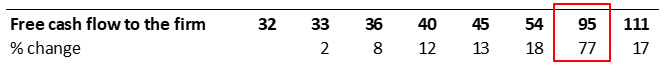
Fig. 3 Free Cash Flow to the Firm
What Does This Cause?
In the first year, in particular, it caused a massive jump in the free cash flow to the firm. The free cash flow to the firm went from 54 to 95, a 77% jump.
But what’s the problem with that I hear you ask?
The problem is that you’re overstating the free cash flow to the firm. When you’re overstating this figure in one year—let’s say, a discrete year—it’s not a big deal. But when you’re overstating towards the end of the discrete period that you’re forecasting, what ends up happening is that you’re carrying on that very high number to infinity—to the terminal value—and, therefore, you may find a situation where you’re overvaluing the stock based upon this assumption.
Another way of looking at it is to look at the basic cash flow versus free cash flow to the firm. We could see that it was in 2020 that the cut came in the Capex.
Going back to the story. I asked the analyst, “Wait a minute, if we go back to this number, why did you choose five in 2020?”
He said, “I didn’t choose five.”
“Okay, why did you get five?”
He said, “Actually, the company gave me the numbers for 2017. They gave Capex guidance: 29 in 2017, 32 in 2018, and 35 in 2019. I just plugged in 5 because I didn’t want to show you zero for 2020 in 2021. But the company gave no guidance.”
So, what do you do in a situation where a company gives no guidance on something like that?
I discussed this with the analyst in question too. Basically, the job of an analyst is to think about the perpetuity of the situation. This company is going to exist for many years going forward; and the CEOs and the management of the company are going to find new investments to spend on. And, therefore, though you don’t have specific guidance from the company, you need to make a fair Capex assumption in those later periods.
If you don’t do that, you’re going to have the problem that I’ve highlighted, which is overinflating the free cash flow to the firm. So, what you’re seeing is a case of an analyst not growing the Capex or the fixed assets as fast as they’re growing the revenue. Valuation mistake #3.
Incompatible Asset to Revenue Growth
I’ve taken the analyst’s company data here and made it simple: Sales, assets, and the sales-to-asset ratio.
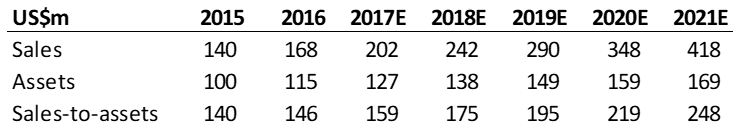
Fig. 4 Company Sales to Assets Data
This company was growing its assets from 100 to 115 in 2015 to 2016—a small growth in assets of 15%. But what we can also see is that the sales are going from 140 to 168.
So, what does that do to the sales-to-asset ratio? It increases from 140 to 146.
That’s pretty good. That means the company is generating 146 in revenue for every 100 in assets it has in place.
But if we look at this number as the analyst forecasted, we’re going to see the amount of sales relative to assets will continue rising and rising. So, we take a company that had sales-to-assets of a 140 and by the time 2021 comes around, it’s at 248 in sales for every 100 in assets.
We can look at that sales-to-asset ratio here in a simple chart.
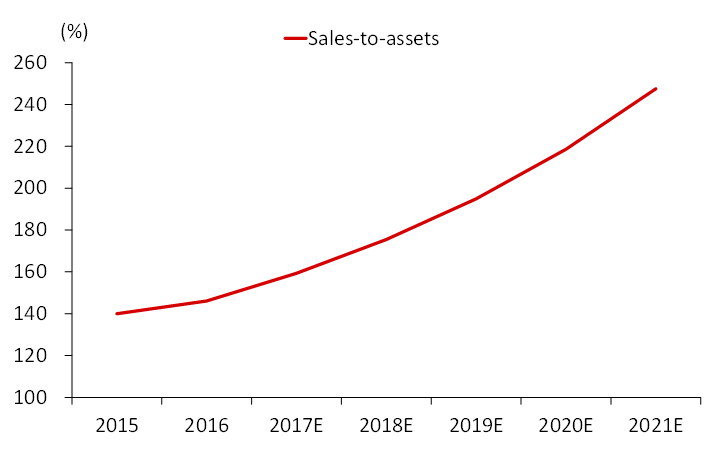
Fig. 5 Sales-to-Assets
And what does this tell us?
This tells us that the analyst has been overly optimistic about sales growth, but it’s probably more likely that the analyst has also not forecasted enough fixed asset growth.
Analysts often underestimate fixed asset growth. It actually happens in almost every analyst that I’ve worked with in the Valuation Master Class in the beginning. You can’t grow the revenue of a company without this fixed asset growth which is why it’s got to be in there—it’s unrealistic otherwise.
How Do We Avoid This Common Mistake?
When forecasting, a good rule of thumb is that fixed asset growth should roughly match revenue. We know that investment and fixed assets are generally lumpy. Investments may not gain the revenue back straightaway as predicted, but, eventually, it comes back in time. But even taking into consideration that the fixed asset growth is lumpy, we want to think that it’s going to grow generally the same as revenue.
Use the asset turnover ratio to prevent this error. It can help you to see when you’re getting unrealistic as we saw in that one chart.
When forecasting, all large deviations in the future should be revised or explained. As I always say to my VMC students, “Revise or explain that.” Either you made a mistake and you need to revise it or you feel comfortable and confident about what that is and can justify it. Now, if you told me, “I’m confident about that 5 in Capex,” then great! Wow! That’s a big number that will impact the free cash flow, and that could cause us to be very bullish on the stock.
But if it’s just that you don’t know what the Capex is, then that’s not as acceptable.
Mistake #3 Conclusion
- Over the long run, companies should grow fixed assets about as fast as revenue.
- If that’s not the case in your forecast, then this is an excellent point of discussion about how you reached your data.
- Prevent this error by using the asset turnover ratio.
Don’t forget to watch the video that accompanies this chapter:
Up next in the series, I discuss confusing growth with maintenance Capex. Read it here now.
The Valuation Master Class provides you with the head start needed to achieve the equity analysis edge you need. Over the course of five modules, you will accumulate a portfolio of 56+ practical valuations on real-world companies. No other course provides the same opportunity to hone your equity analysis skills in the same way.