Global Sectors: Massive Profitability in Health Care
Global Sectors FVMR Snapshot
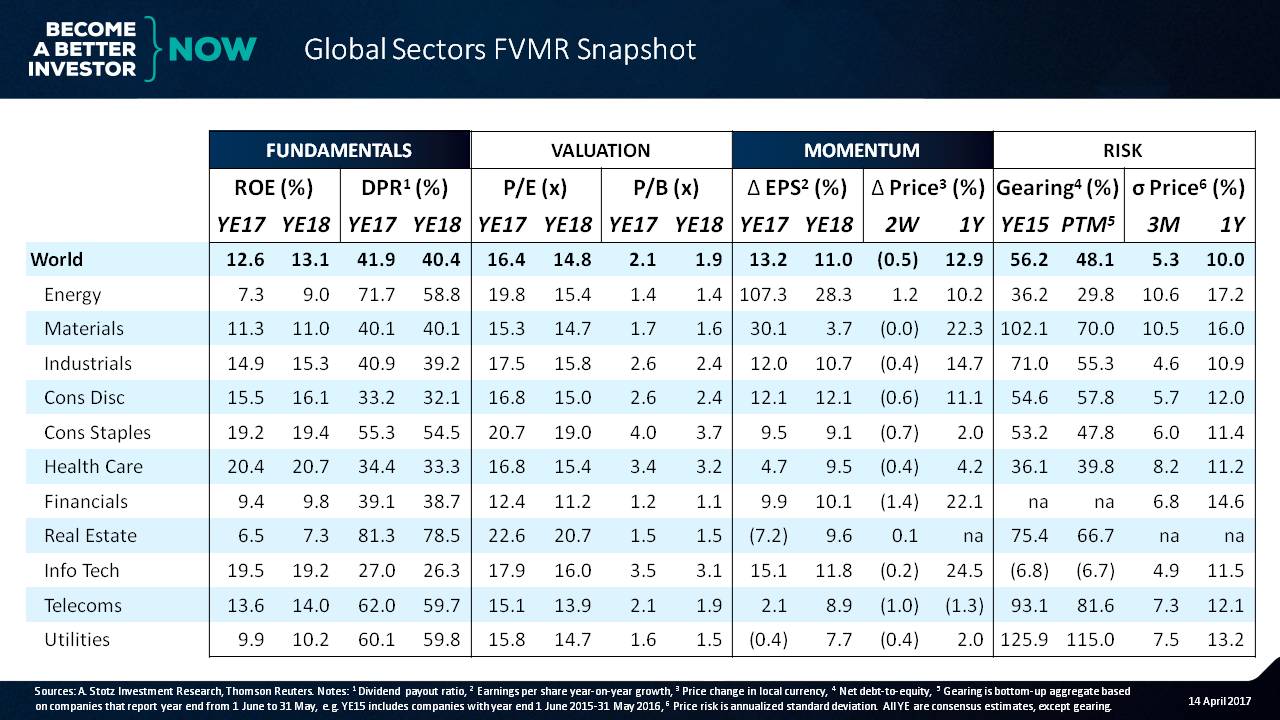
Global overview:
What we can see is that the global ROE is about 13%. Dividend payout ratio across all companies in the world is about 40% to 42%. The PE across the world is about 15X to 16X. Price-to-book is about 2x. And what we can see is that the EPS growth expectations are about 12%.
Over the past two weeks the market has fallen, but we can see that over the last year we’ve experienced about a 13% rise in the global market.
Across the world the net debt-to-equity was about 56% in 2015; and in the past twelve months, that’s come down to about 48%.
As far as price volatility, we can see that over the last three months, volatility has been relatively low compared to the past one year at about 10%.
Sector by sector
Let’s take a look and understand a little bit about a few of the sectors.
Fundamentals: Massive profitability in Health Care
What we can see here is that the health care sector has an ROE of 20%, which is pretty massive followed by the information technology and consumer staples sectors.
What we can also see is that the dividend payout ratio is highest for real estate. Of course, that figure includes real estate REITs that are paying out dividends.
Of the operating companies, we’ve got telecoms and utilities.
Valuation: Rich valuation of Consumer Staples
If we look at the PE ratio, we can see that the Return on Equity (ROE) is quite high, and we can also see that the PE is very high for the consumer staples sector.
Information technology is somewhat reasonable at about 17.9 times earnings.
Since oil prices have been coming down, we can see that the PE of oil, which is a cyclical business, is a bit high, and that’s partially because earnings have been low.
Recently, the sector has been recovering, and we can see the recovery in oil prices feeding through here in the EPS.
We can also see a slowdown in the real estate sector’s EPS. As far as the utility sector is concerned, there’s also a bit of a slowdown expected.
The biggest expectation for improvement in EPS come in the cyclical sectors, and those are energy and materials.
If we look at the price-to-book, the cheapest price-to-book ─ as often is the case ─ is the banking sector. Here we can see it trading just slightly over the book value. Of course, banks’ book value is a lot closer to the market value as compared to other companies. That’s one of the reasons why the financials tend to receive a lower value.
The highest valued industry right now on a price-to-book basis is the consumer staples industry at about 4%.
Momentum: Telecom has been hit the hardest
If we look at the last year, we can see that the biggest price improvements have come in the information technology sector. Telecom, however, has been hit the hardest.
As far as gearing is concerned, we can see that the materials sector is on the high end ─ meaning risk is a bit high. This is a different situation compared to telecom and utilities, which are also high. But these two tend to be high, because they have very stable businesses.
Usually, when materials is highly leveraged, it’s because there’s some distress going on or the company’s profits have been hurt. And we can see that ROE is about 11%.
Risk: Highest volatility in Energy and Materials
Finally, if we look at the volatility in price, what we can see is that the highest volatility is coming from energy and materials which are, once again, cyclical sectors.
The lowest volatility is coming from industrials, which is a little bit odd because that also tends to be a cyclical industry.
So there we get a suggestion of what’s happening across the world.
The ROE is about 13%. The world is valued at a PE of 15x and about a price-to-book value of 2x. And analysts are expecting about a 14% EPS growth.
Get our Equity FVMR Snapshots for free to your inbox every Monday!
DISCLAIMER: This content is for information purposes only. It is not intended to be investment advice. Readers should not consider statements made by the author(s) as formal recommendations and should consult their financial advisor before making any investment decisions. While the information provided is believed to be accurate, it may include errors or inaccuracies. The author(s) cannot be held liable for any actions taken as a result of reading this article.