The Buffett Indicator Reveals Potential Opportunities in Asia
The Buffett Indicator
Mark Hirschey, Warren Buffett KU Visit, CC BY-SA 2.0
Total Market Cap to Gross National Product (GNP) was made popular by Warren Buffett and is often referred to as the Buffett Indicator. “It is probably the best single measure of where valuations stand at any given moment,” said Warren Buffett in 2001 to Fortune Magazine.
The Buffett Indicator is like Price-to-Sales for an economy
Due to data availability, Gross Domestic Product (GDP) is often used instead of GNP; the indicator will generally still show the same change and trends. GDP can be thought of as a country’s revenue, so in a way, Total market cap-to-GDP could be thought of as a Price-to-Sales ratio for the whole economy.
Some criticism of the Buffett Indicator
While one of the best and most well-known investors is said to find the ratio very useful, it’s not without its drawbacks. It may not be a ratio for short-term market timing, but rather long-term performance. The ratio is impacted by IPOs and de-listings even if the valuation would remain constant. A company can be listed in one country (contributing to market cap) and do business in another country (contributing to GDP).
A low value on the Buffett Indicator appears to lead to high subsequent 1-year return
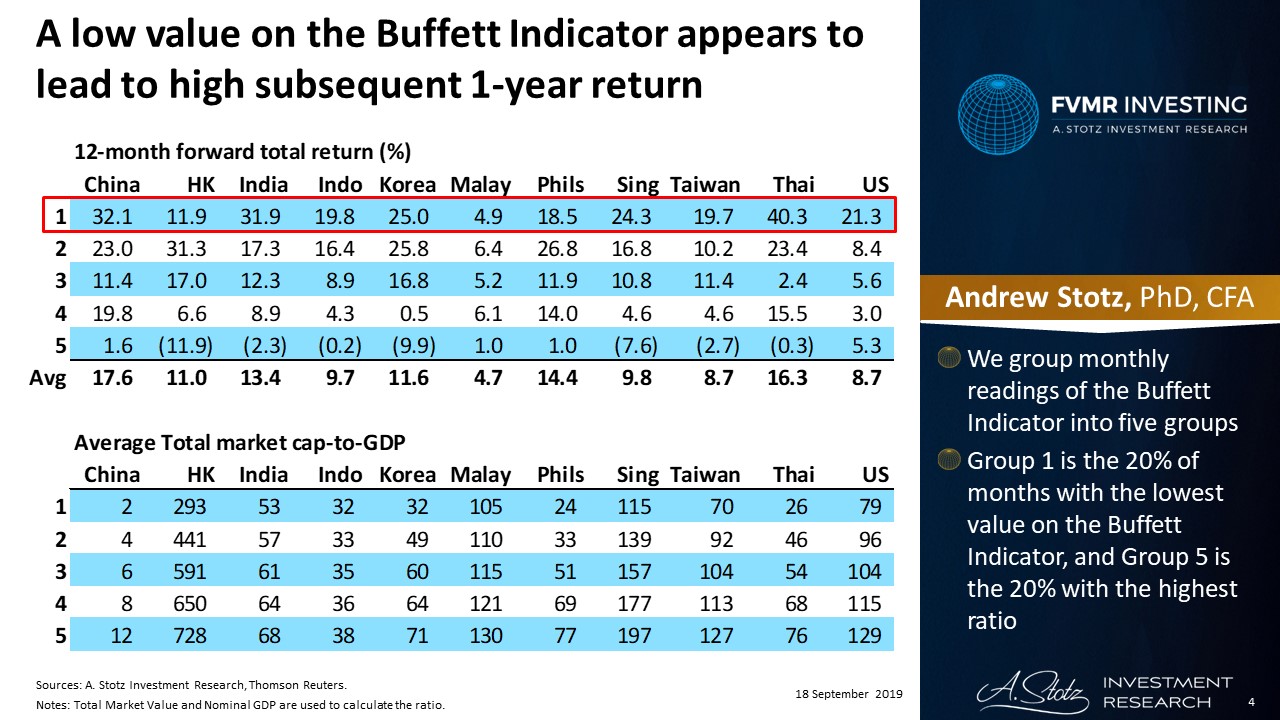
We group monthly readings of the Buffett Indicator into five groups. Group 1 is the 20% of months with the lowest value on the Buffett Indicator, and Group 5 is the 20% with the highest ratio. In most markets, it seems to be best to buy the market when the ratio shows a low number. In Hong Kong and Malaysia, it doesn’t show that clearly, but in both markets, you do best in not buying the market when the Buffett Indicator is high.
US: Among the highest readings ever
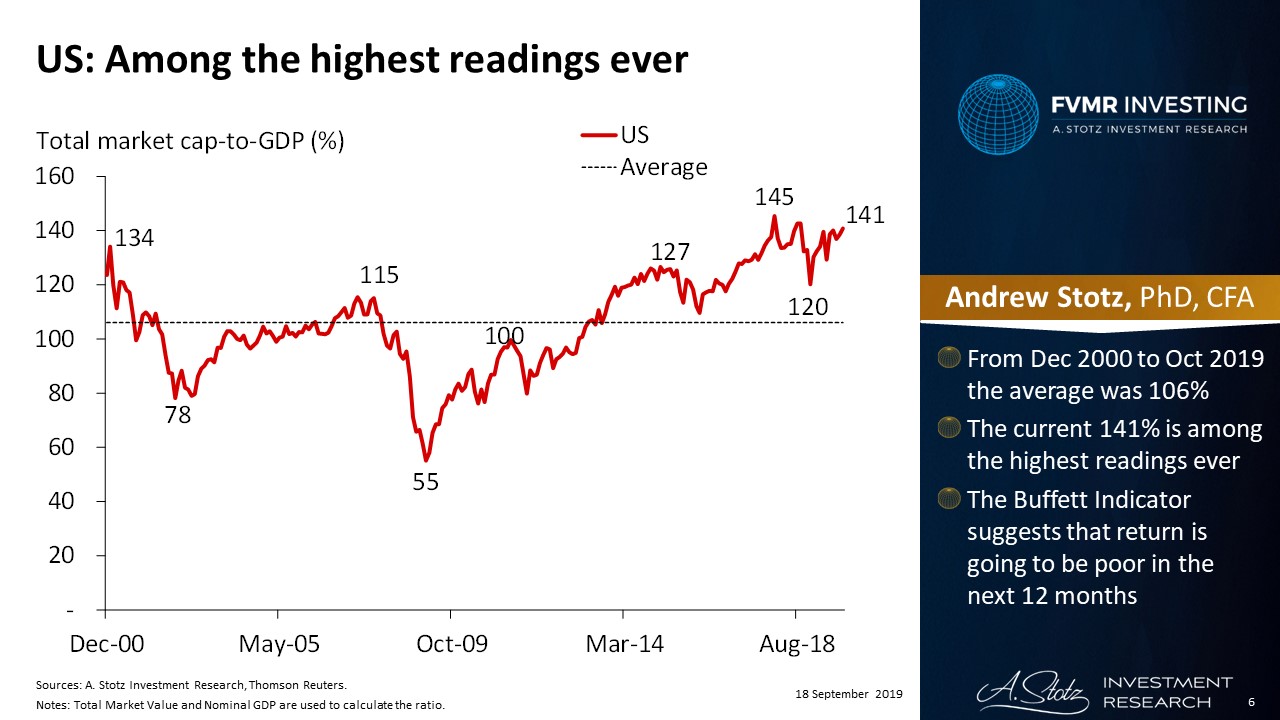
From December 2000 to October 2019 the average was 106%. The current 141% is among the highest readings ever. The Buffett Indicator suggests that return is going to be poor in the next 12 months.
US: Has only traded at this high ratio in 2% of the past 227 months
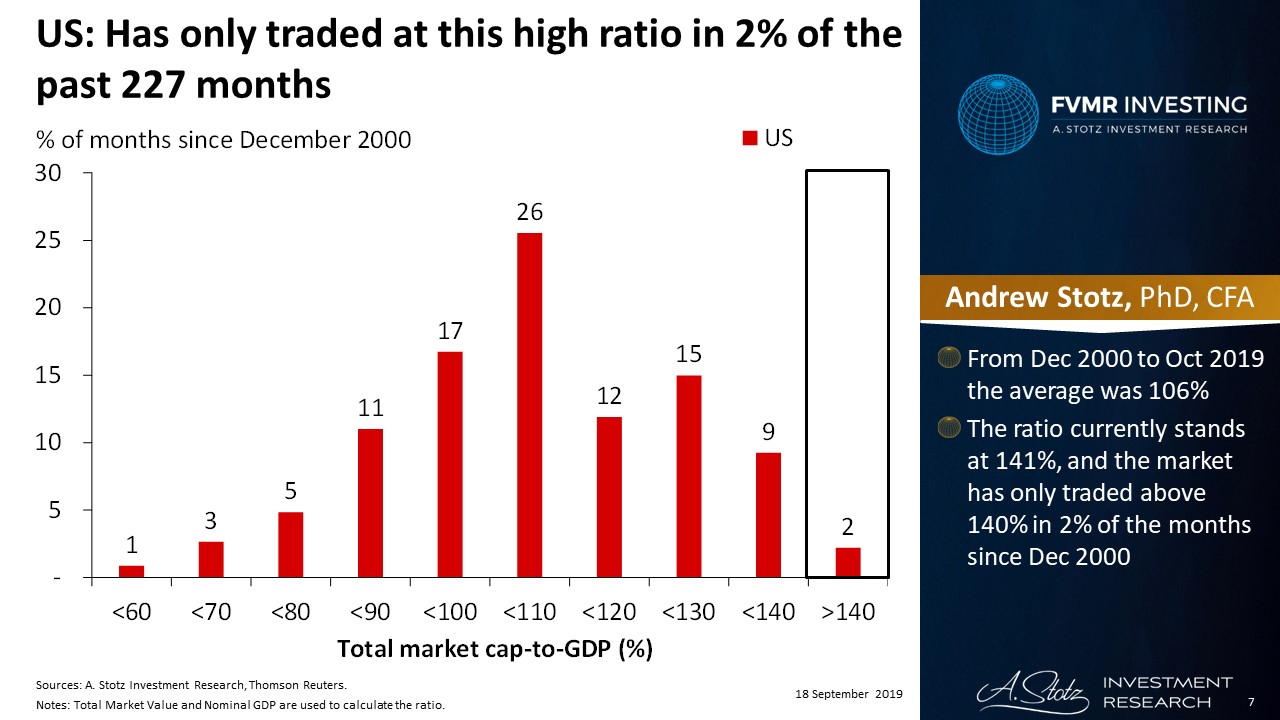
From December 2000 to October 2019 the average was 106%. The ratio currently stands at 141%, and the market has only traded above 140% in 2% of the months since December 2000.
China: The stock market is tiny relative to the overall economy
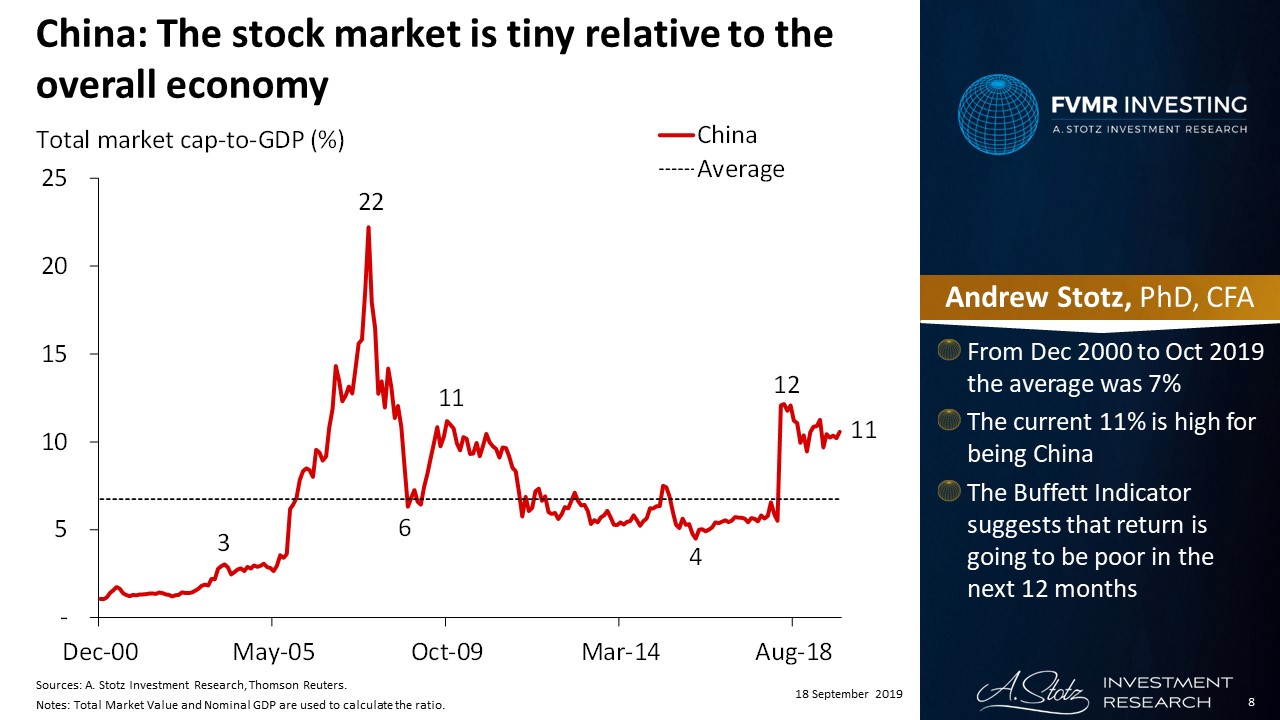
From December 2000 to October 2019 the average was 7%. The current 11% is high for being China. The Buffett Indicator suggests that return is going to be poor in the next 12 months.
China: Has only traded in this range or above in 20% of months since Dec 2000
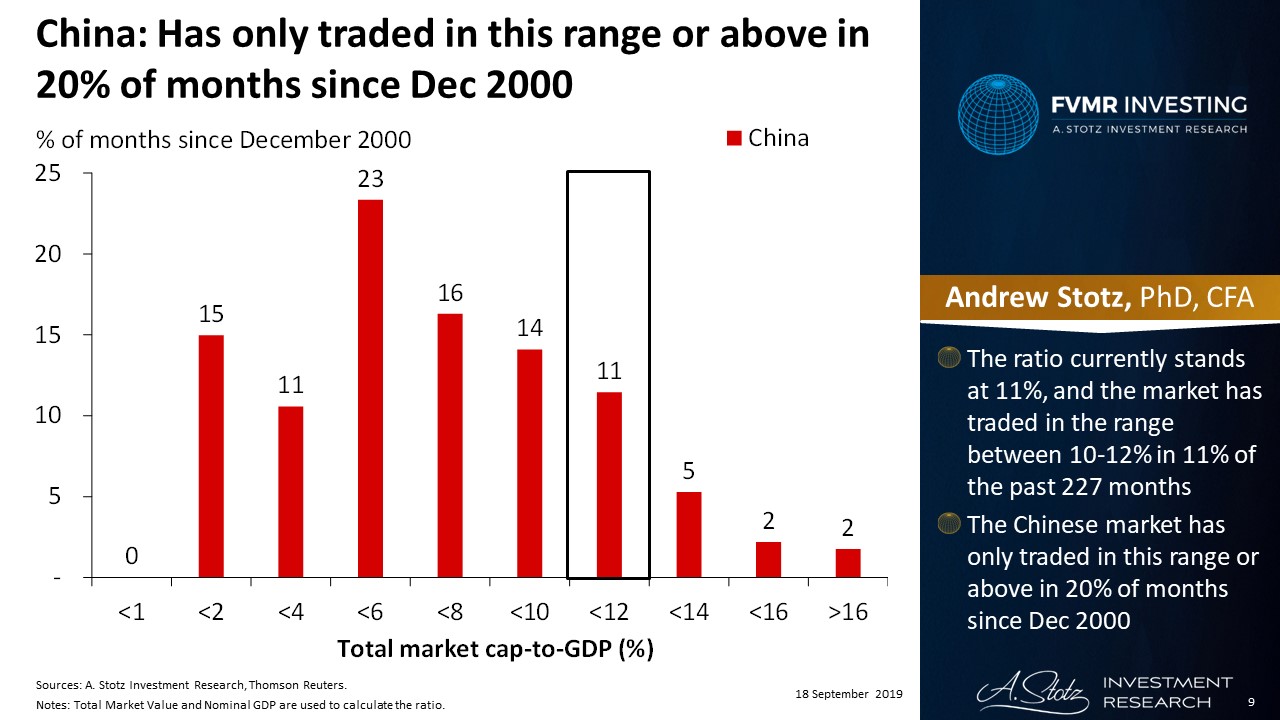
The ratio currently stands at 11%, and the market has traded in the range between 10-12% in 11% of the past 227 months. The Chinese market has only traded in this range or above in 20% of months since December 2000.
Hong Kong: The current 692% is moderately high
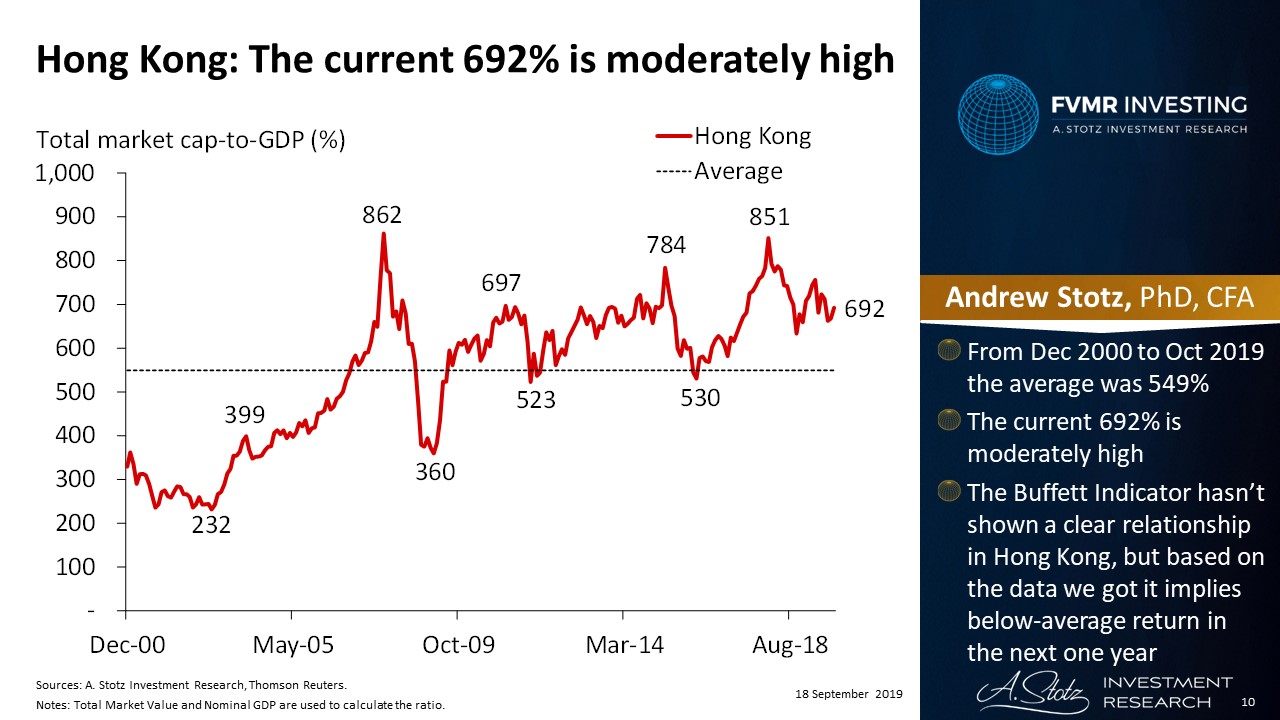
From December 2000 to October 2019 the average was 549%. The current 692% is moderately high. The Buffett Indicator hasn’t shown a clear relationship in Hong Kong but based on the data we got it implies below-average return in the next one year.
Hong Kong: Has traded here or higher 35% of months
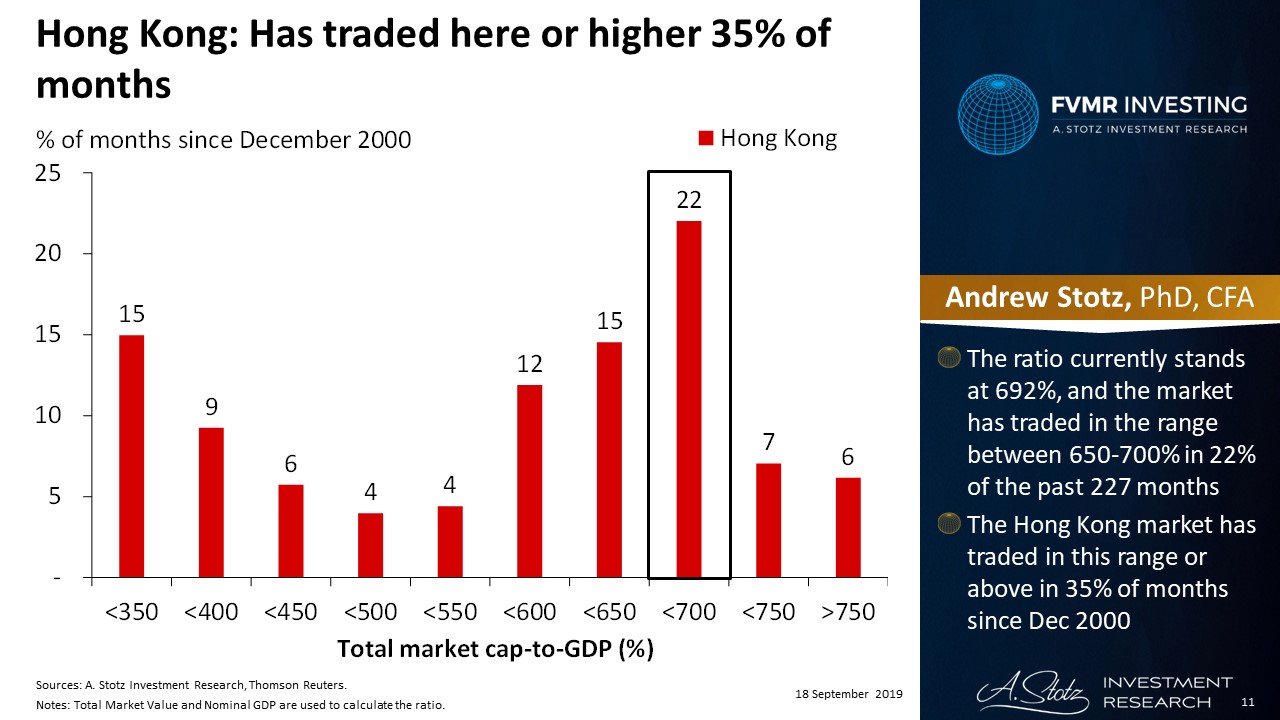
The ratio currently stands at 692%, and the market has traded in the range between 650-700% in 22% of the past 227 months. The Hong Kong market has traded in this range or above in 35% of months since December 2000.
Korea: Close to average on the Buffett Indicator
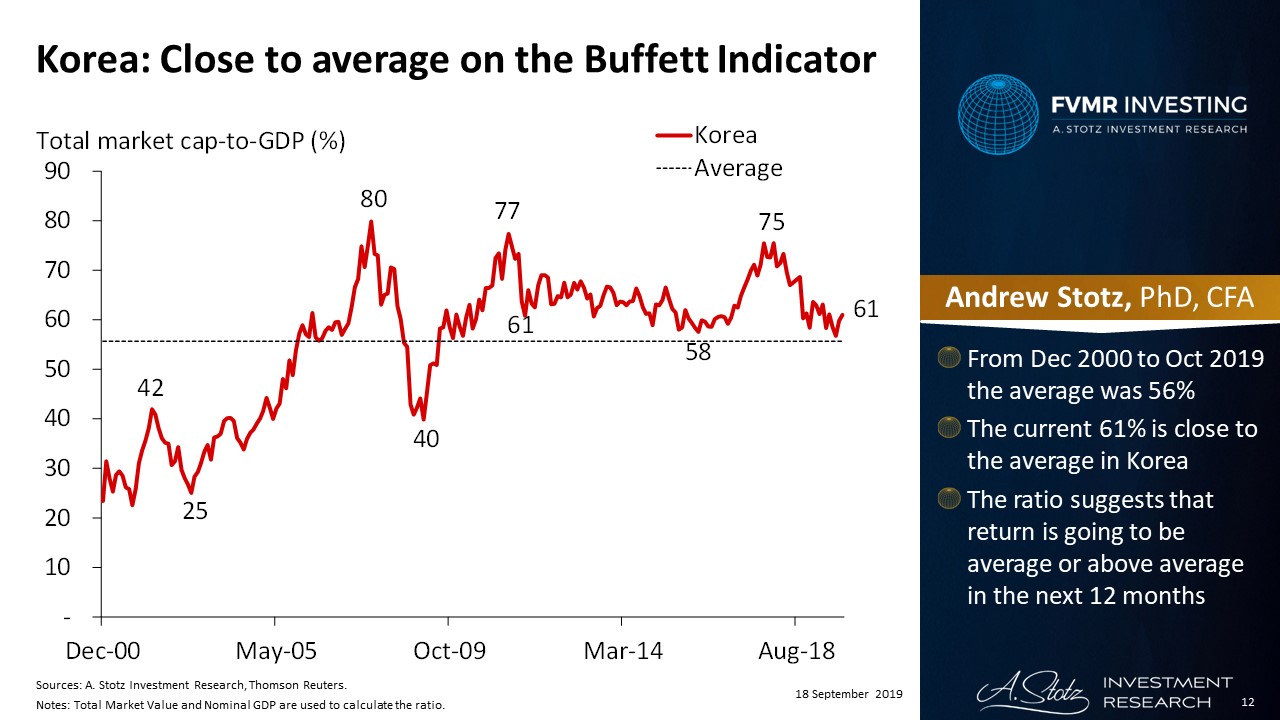
From December 2000 to October 2019 the average was 56%. The current 61% is close to the average in Korea. The ratio suggests that return is going to be average or above average in the next 12 months.
Korea: Has traded in this range or above in 52% of months
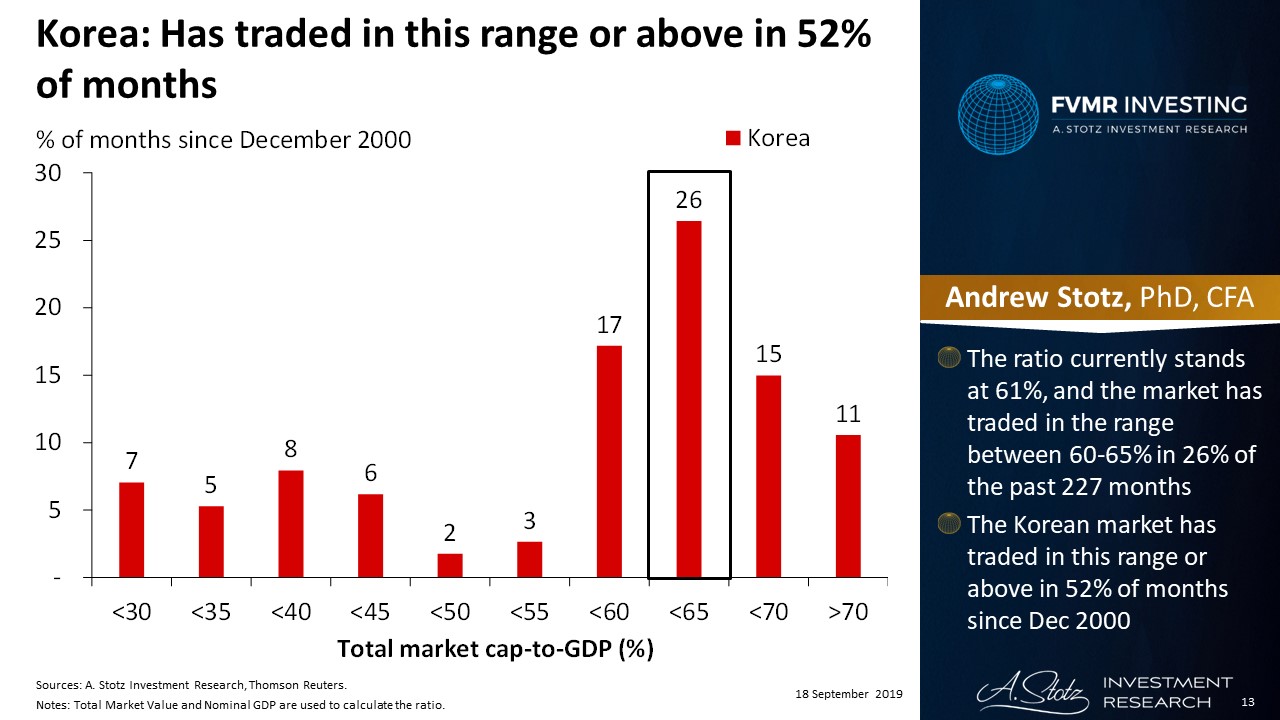
The ratio currently stands at 61%, and the market has traded in the range between 60-65% in 26% of the past 227 months. The Korean market has traded in this range or above in 52% of months since December 2000.
Philippines: The Buffett Indicator suggests a below-average return in the next year
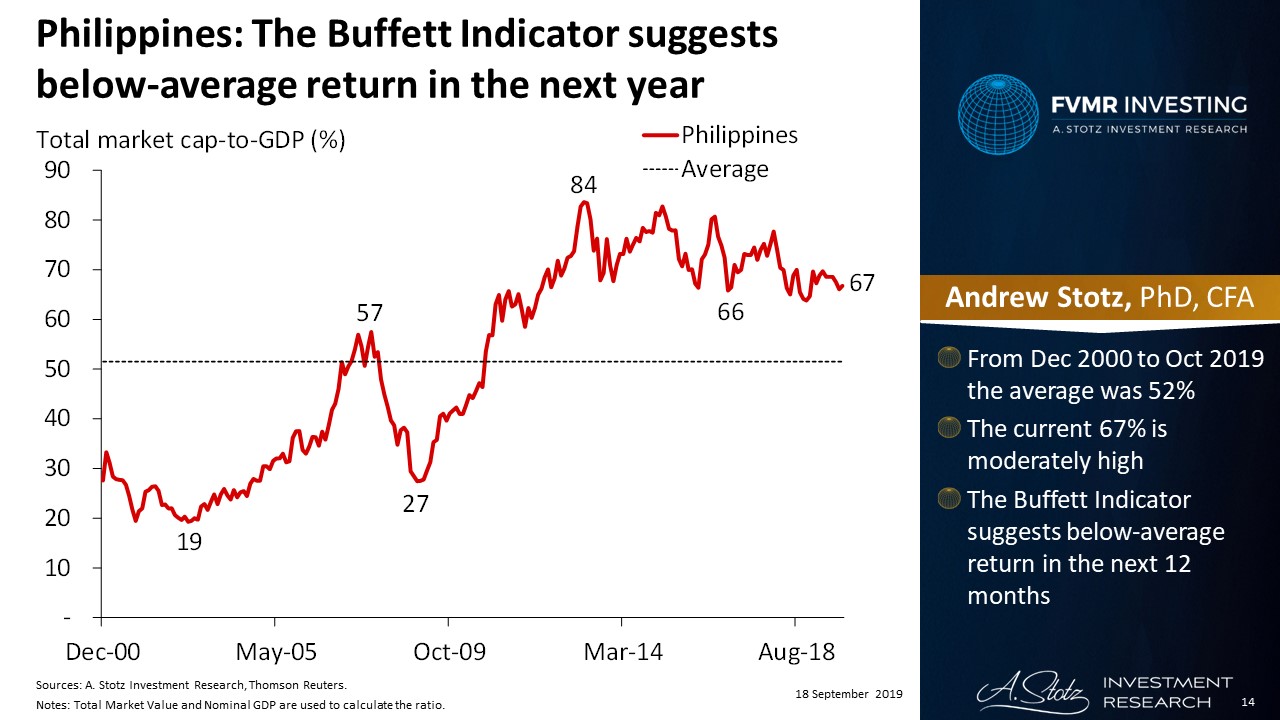
From December 2000 to October 2019 the average was 52%. The current 67% is moderately high. The Buffett Indicator suggests a below-average return in the next 12 months.
Philippines: Has traded in this range in 16% of the past 227 months
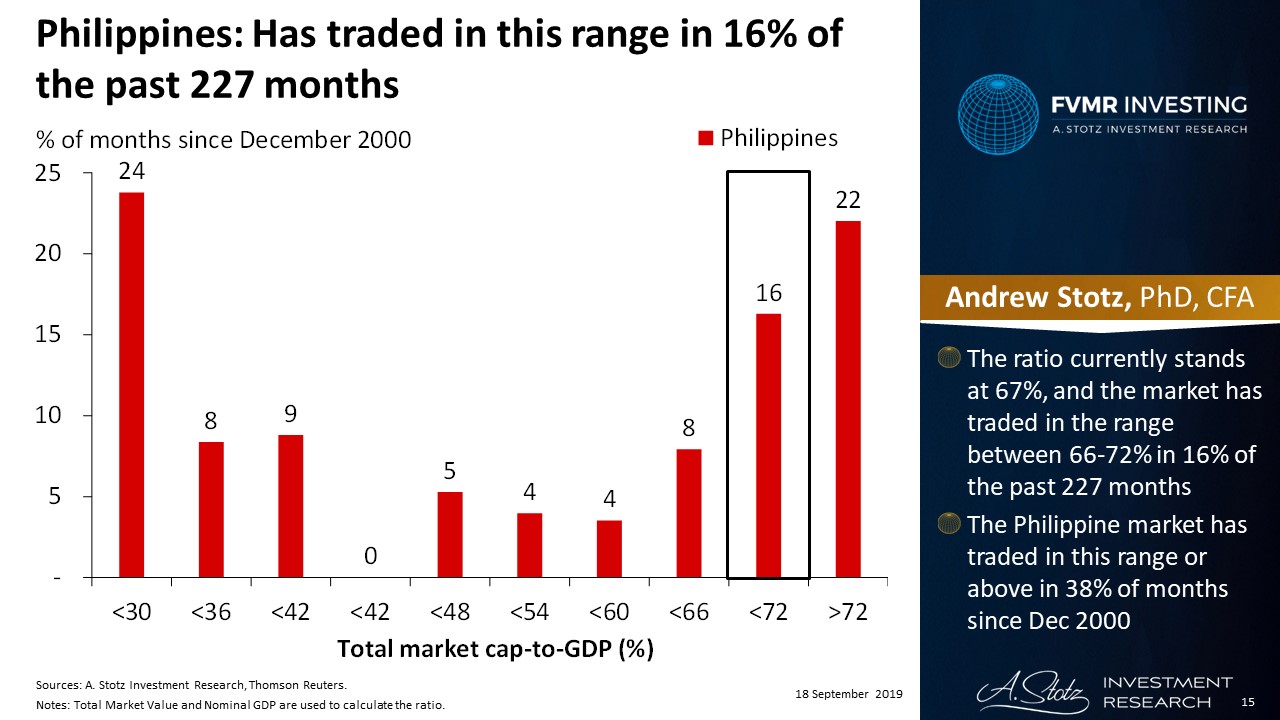
The ratio currently stands at 67%, and the market has traded in the range between 66-72% in 16% of the past 227 months. The Philippine market has traded in this range or above in 38% of months since December 2000.
Singapore: Current reading suggests average return for the next one year
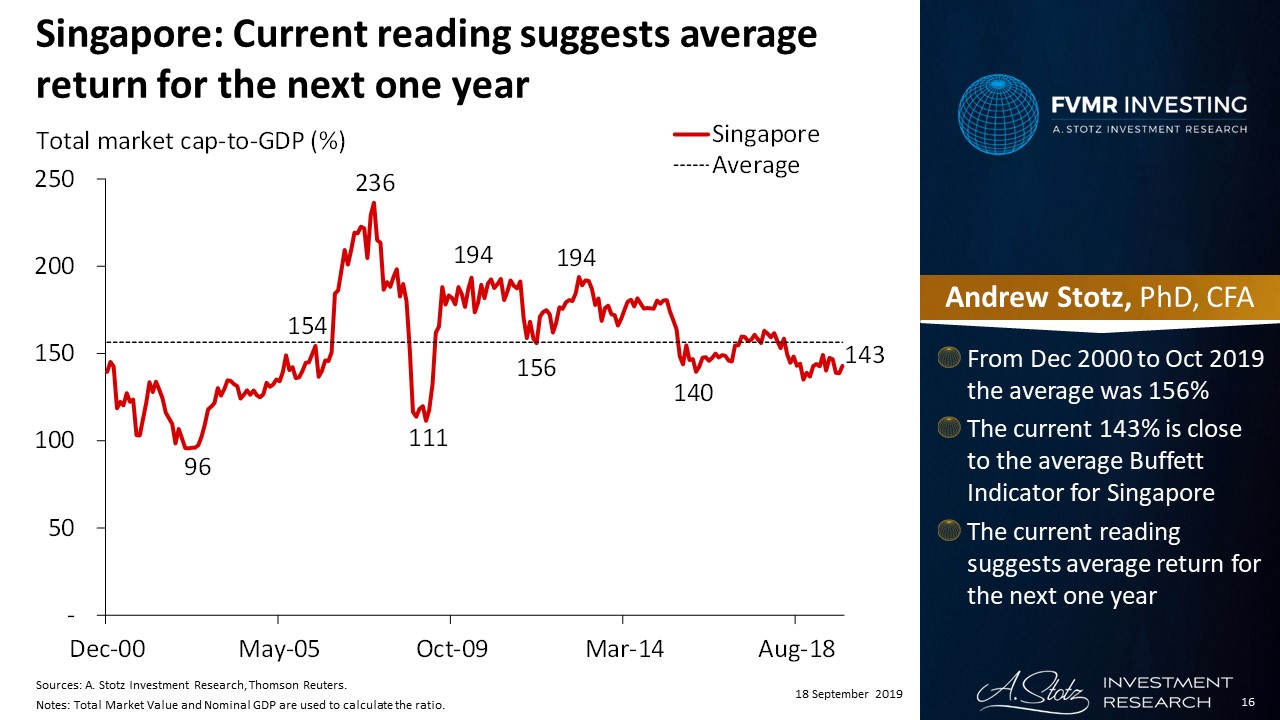
From December 2000 to October 2019 the average was 156%. The current 143% is close to the average Buffett Indicator for Singapore. The current reading suggests an average return for the next year.
Singapore: Has traded in this range or below in 48% of months
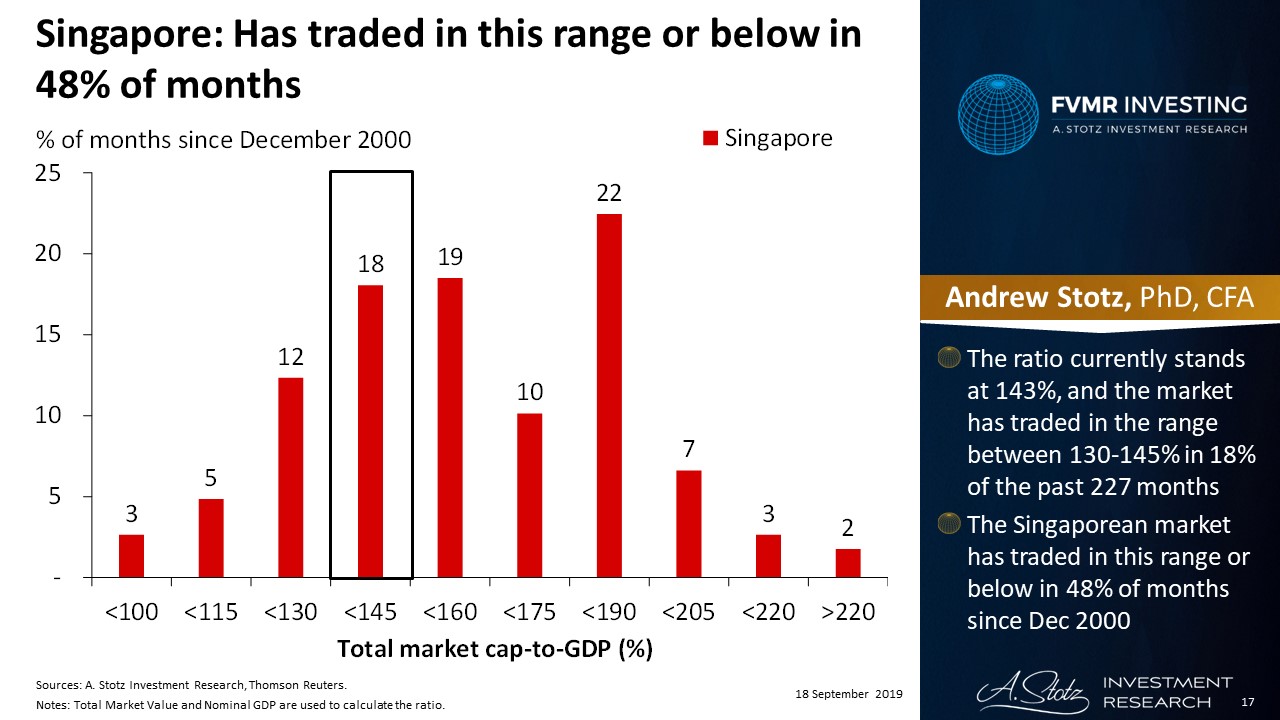
The ratio currently stands at 143%, and the market has traded in the range between 130-145% in 18% of the past 227 months. The Singaporean market has traded in this range or below in 48% of months since December 2000.
Taiwan: Current 141% is among the highest readings ever
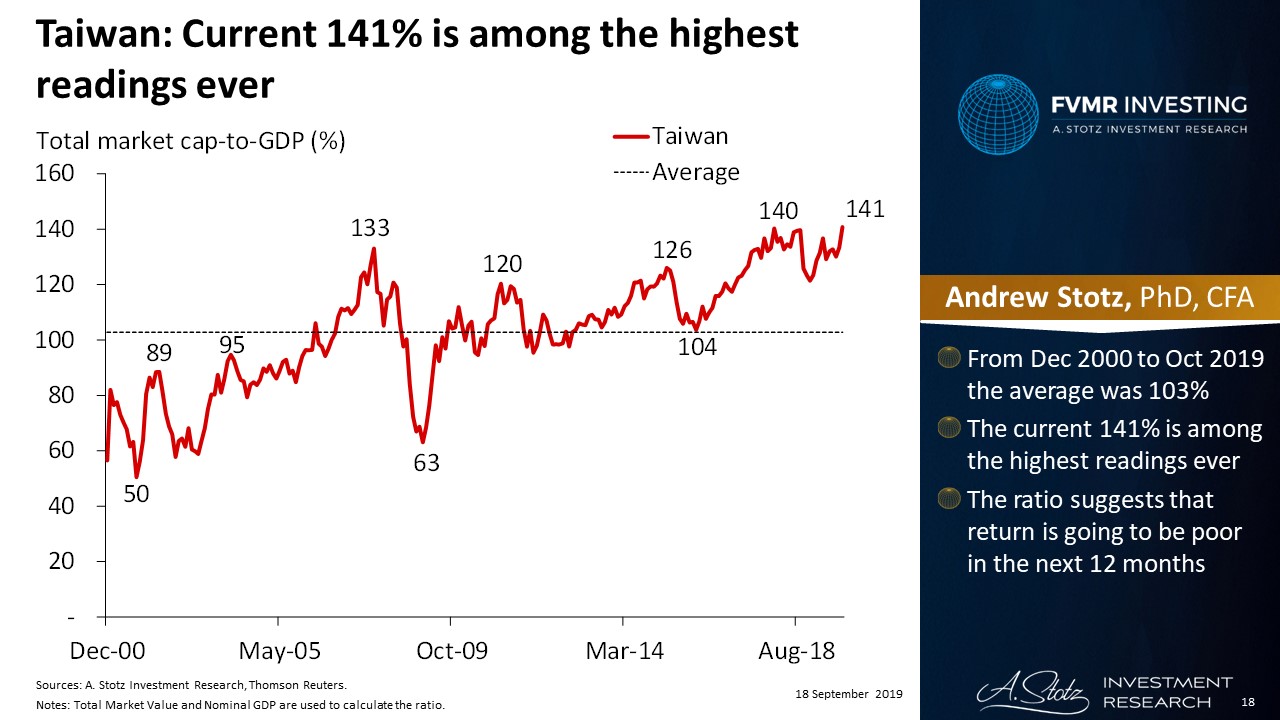
From December 2000 to October 2019 the average was 103%. The current 141% is among the highest readings ever. The ratio suggests that the return is going to be poor in the next 12 months.
Taiwan: Has only traded above 135% in 4% of the months
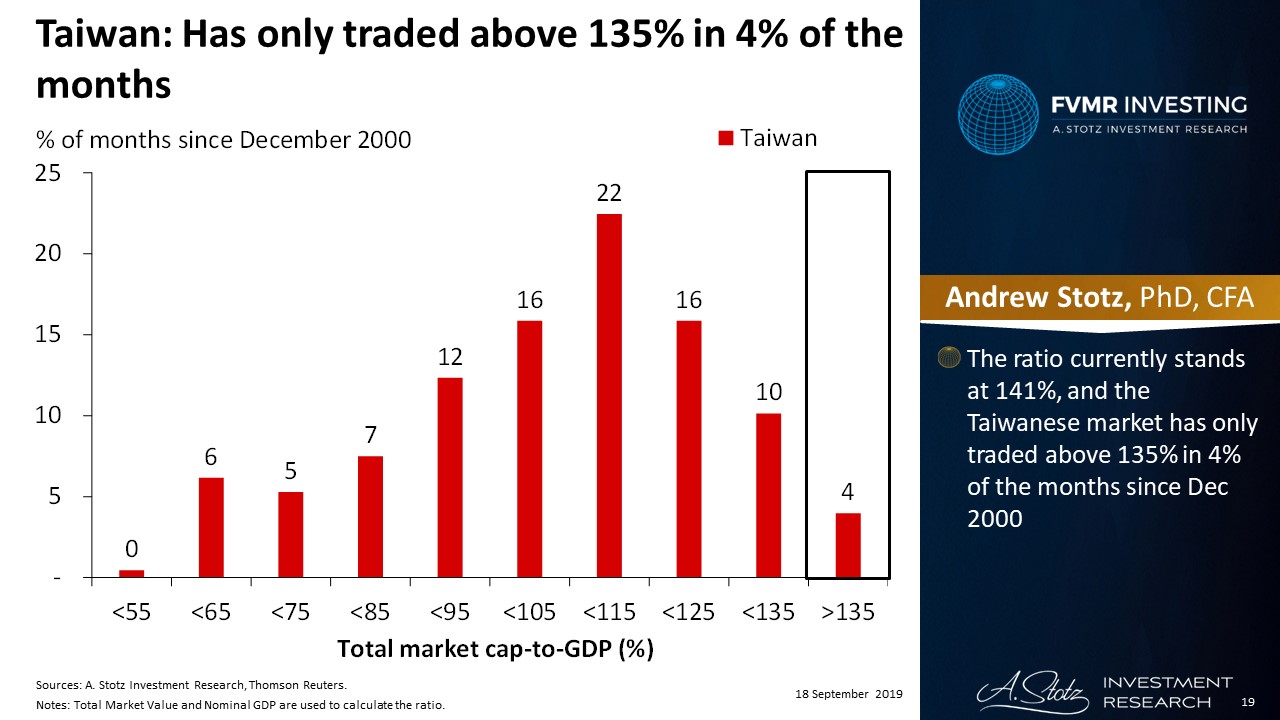
The ratio currently stands at 141%, and the Taiwanese market has only traded above 135% in 4% of the months since December 2000.
Thailand: The Buffett Indicator suggests a below-average return in the next one year
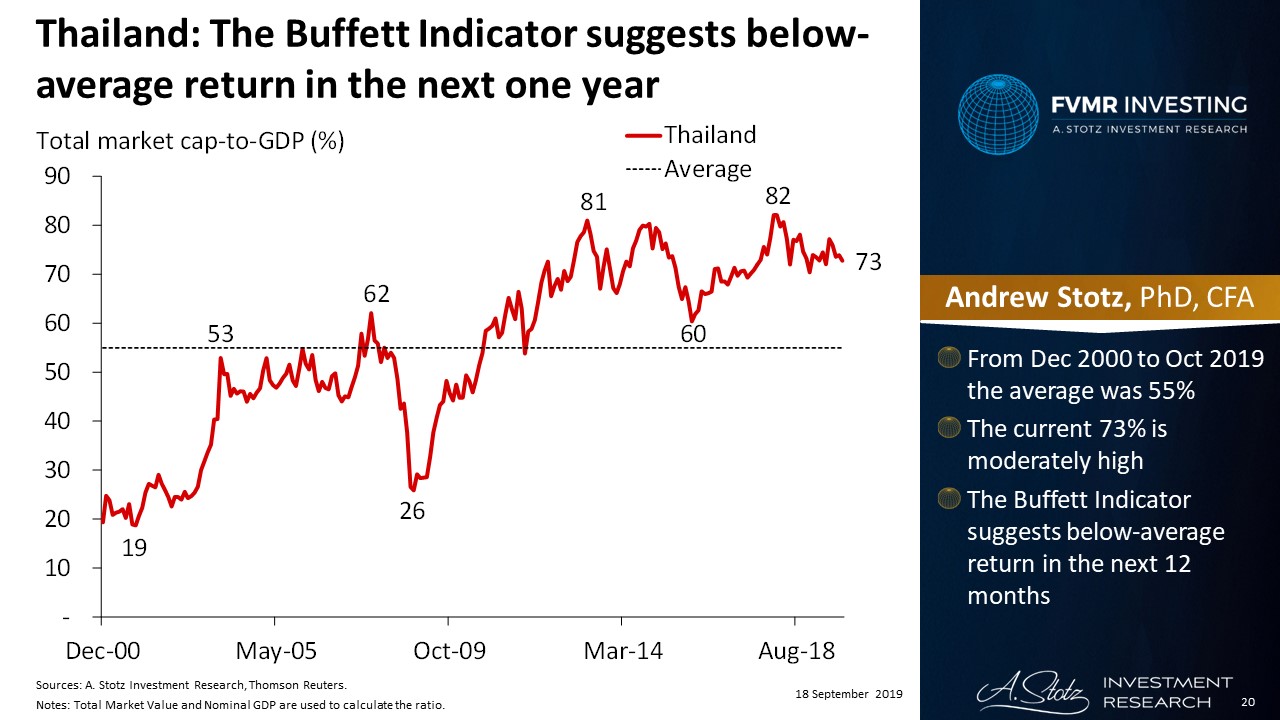
From December 2000 to October 2019 the average was 55%. The current 73% is moderately high. The Buffett Indicator suggests a below-average return in the next 12 months.
Thailand: Has traded in this range or above in 34% of months
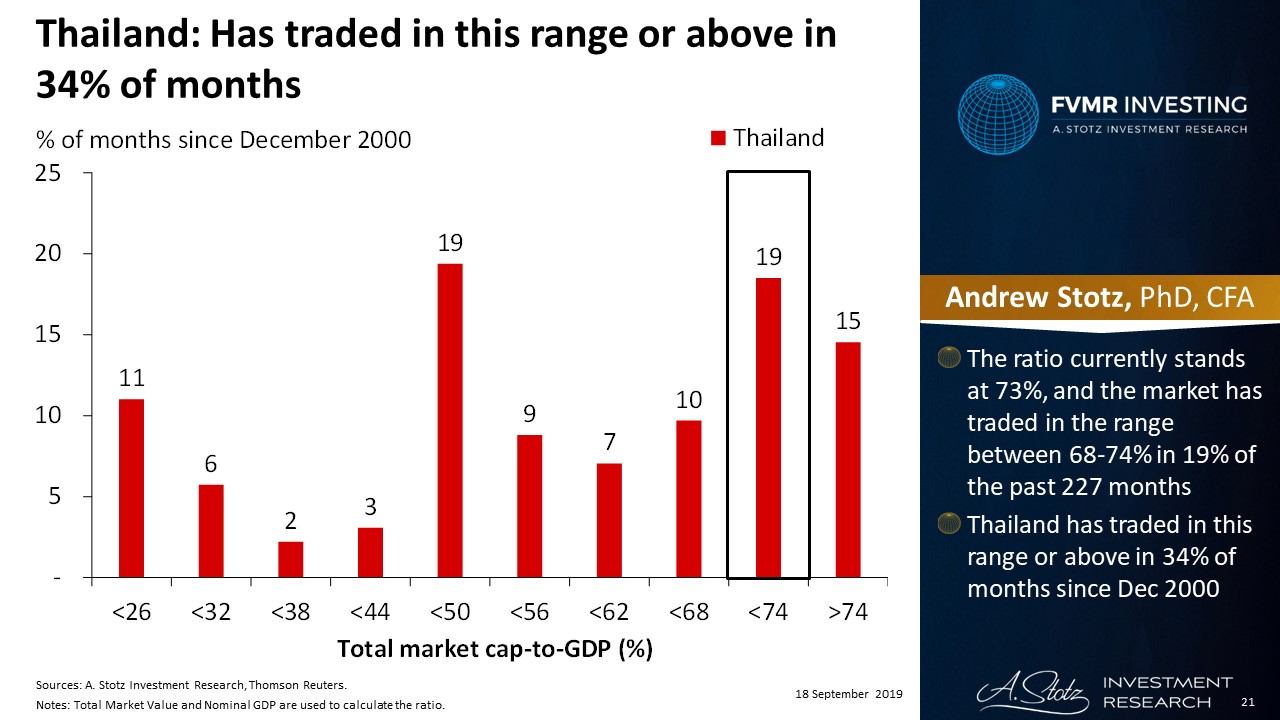
The ratio currently stands at 73%, and the market has traded in the range between 68-74% in 19% of the past 227 months. Thailand has traded in this range or above in 34% of months since December 2000.
India: We would expect the next one-year return to be poor
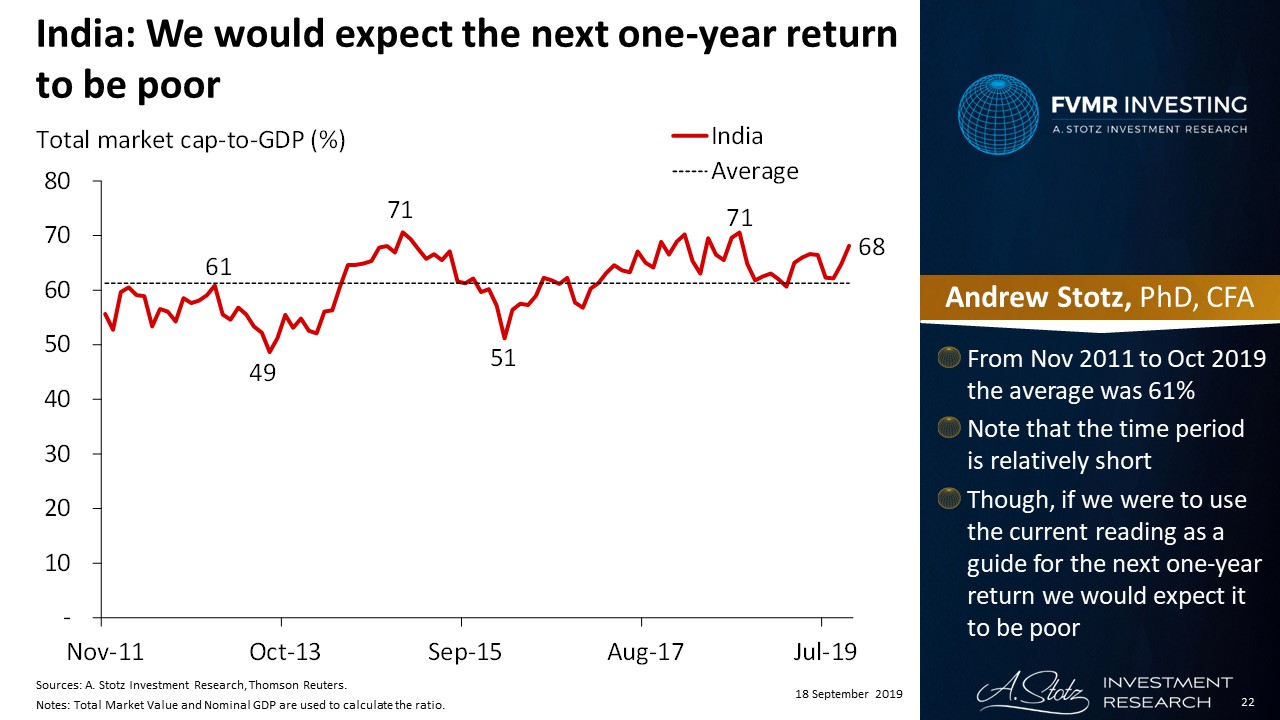
From November 2011 to October 2019 the average was 61%. Note that the time period is relatively short. Though, if we were to use the current reading as a guide for the next one-year return we would expect it to be poor.
India: Has only traded at this level or above 10% of months
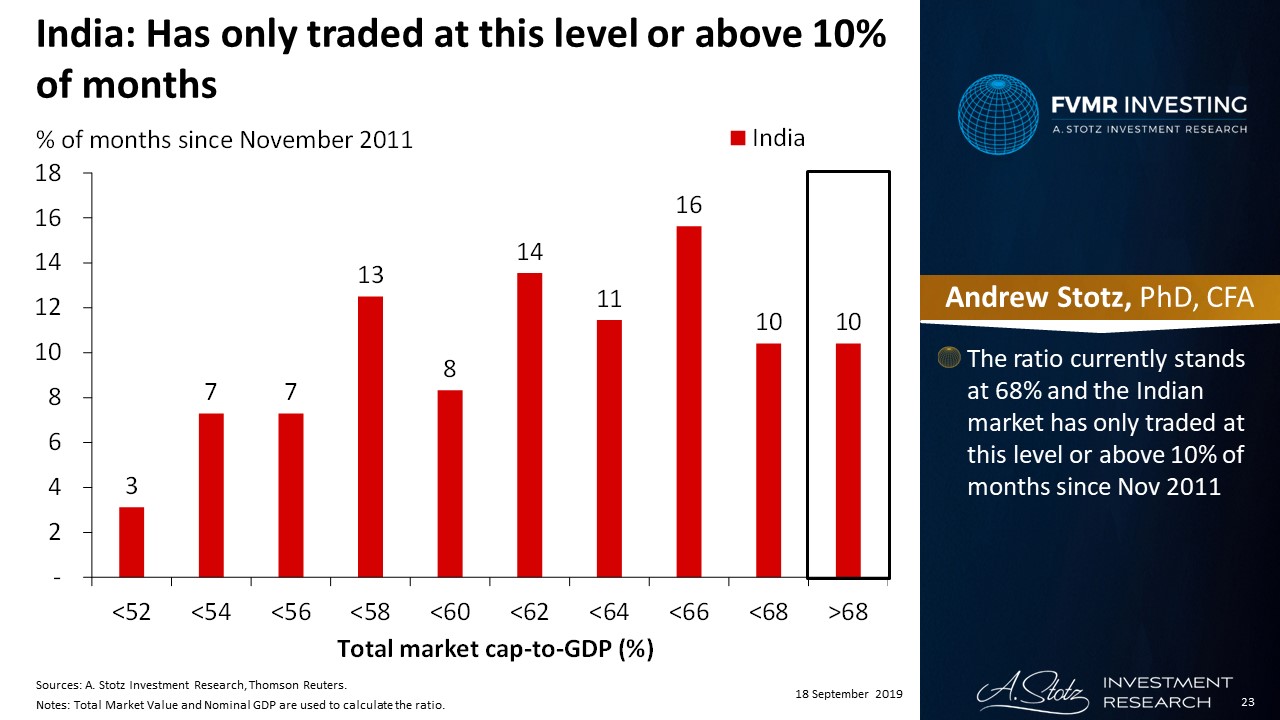
The ratio currently stands at 68% and the Indian market has only traded at this level or above 10% of months since November 2011.
Indonesia: The Buffett Indicator implies a forward 12-month return above average
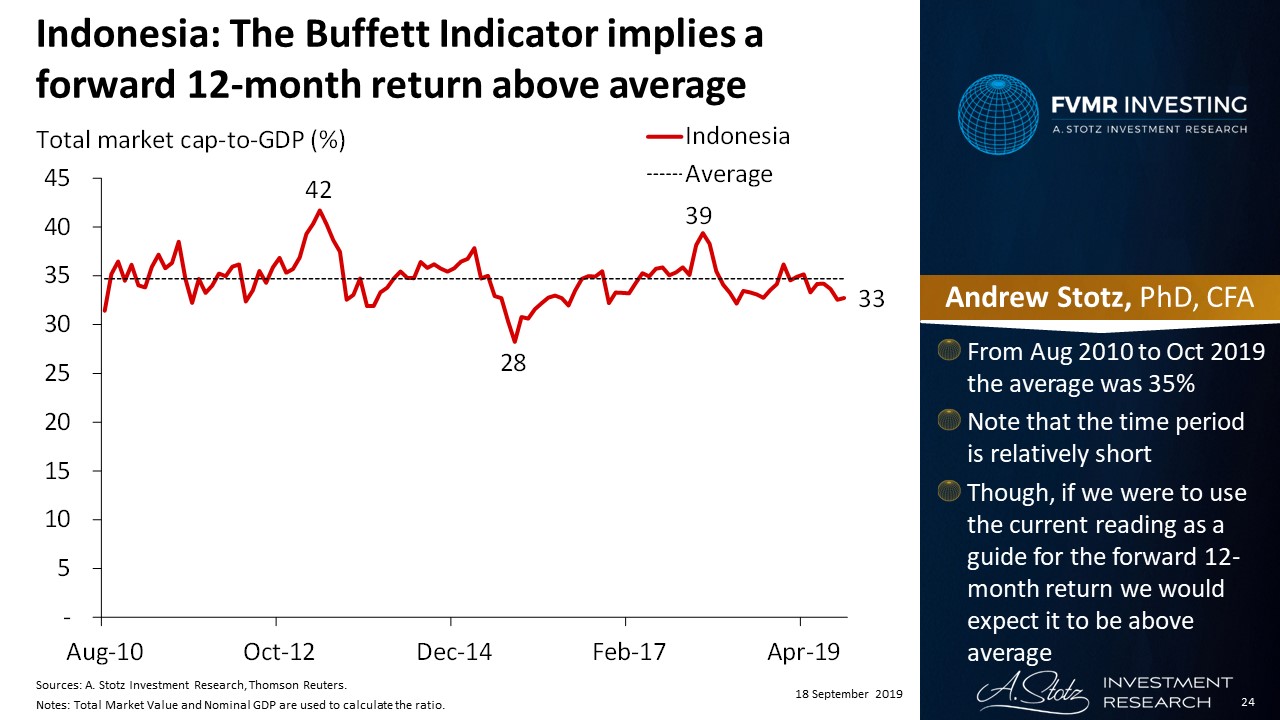
From August 2010 to October 2019 the average was 35%. Note that the time period is relatively short. Though, if we were to use the current reading as a guide for the forward 12-month return we would expect it to be above average.
Indonesia: Has traded at this level or below 37% of months
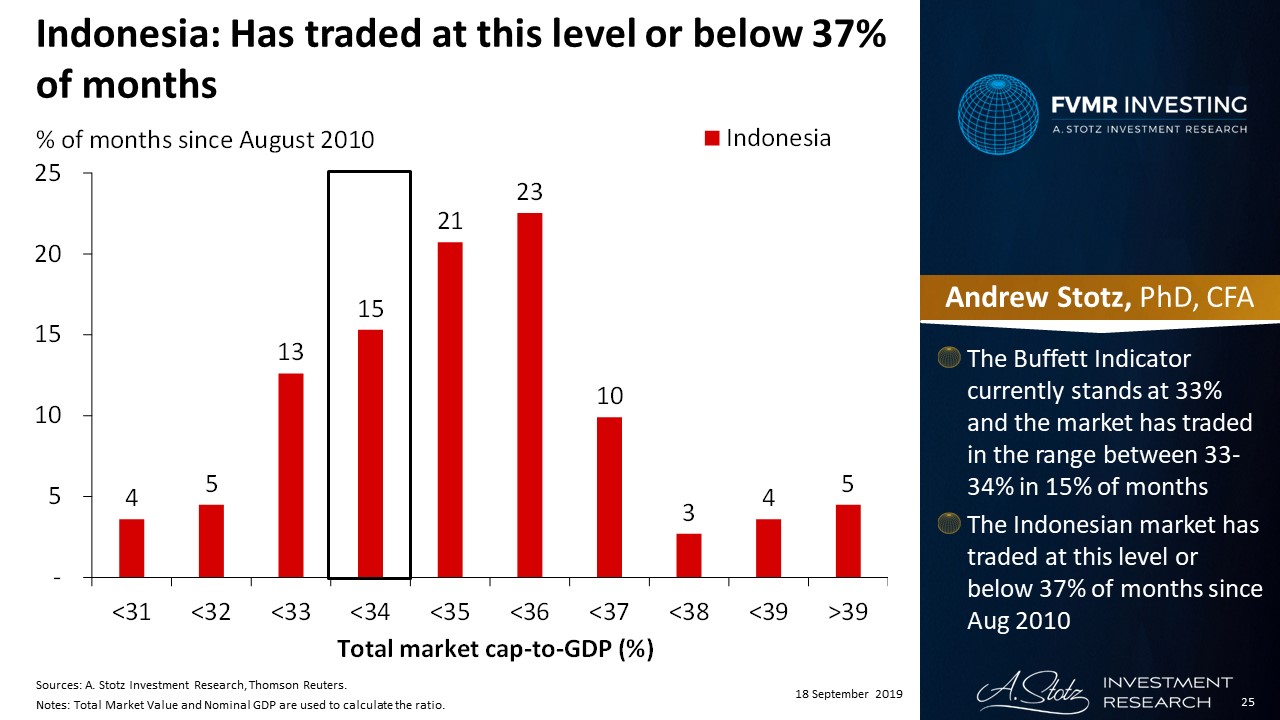
The Buffett Indicator currently stands at 33% and the market has traded in the range between 33-34% in 15% of months. The Indonesian market has traded at this level or below 37% of months since August 2010.
Malaysia: The Buffett Indicator hasn’t shown a clear relationship with return
![]()
From August 2010 to October 2019 the average was 114%. Note that the time period is relatively short. The Buffett Indicator hasn’t shown a clear relationship in Malaysia but based on the data we got it implies average return in the next 12 months.
Malaysia: Has only traded at this low level in 8% of months
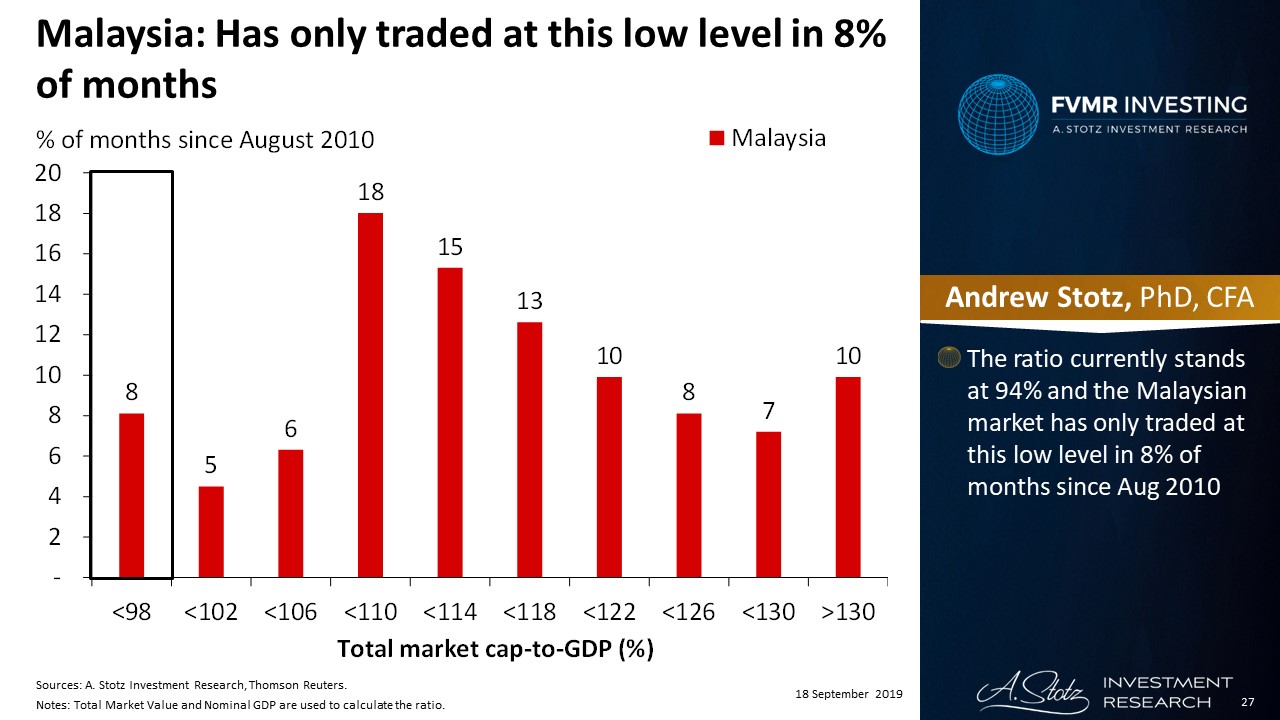
The ratio currently stands at 94% and the Malaysian market has only traded at this low level in 8% of months since August 2010.
Action
In most markets, it seems to be wise to avoid investing when the Buffett Indicator is very high. It also, appears that you can expect an above-average return if you invest when the ratio is very low. The measure doesn’t seem to work in all markets, though.
DISCLAIMER: This content is for information purposes only. It is not intended to be investment advice. Readers should not consider statements made by the author(s) as formal recommendations and should consult their financial advisor before making any investment decisions. While the information provided is believed to be accurate, it may include errors or inaccuracies. The author(s) cannot be held liable for any actions taken as a result of reading this article.