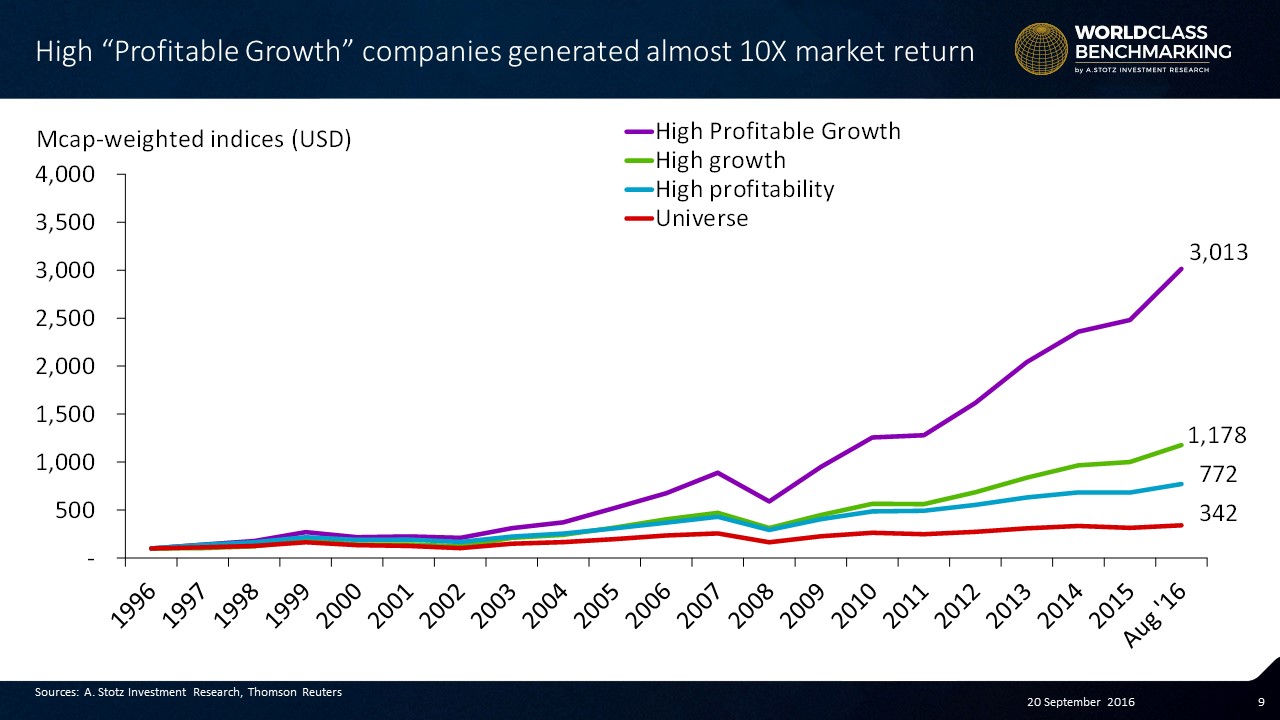
High Profitable Growth Companies Saw Value Gains of ~10x the Market
Watch the video with Andrew Stotz or read below about how we use World Class Benchmarking to analyze a company’s financial performance.
This post is going to give you more insights to the World Class Benchmarking we use to analyze a company’s financial performance at A. Stotz Investment Research. We’re going to explain the measure that we focus on which is Profitable Growth. And that’s what matters to us when we’re helping business leaders to improve the financial performance of their company
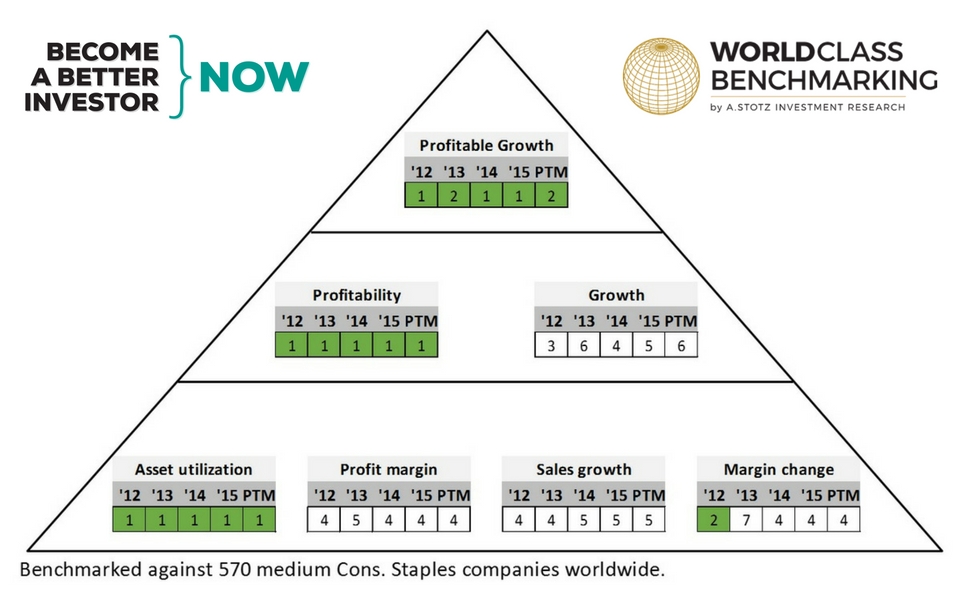
We focus on Profitable Growth which is at the top of our financial performance triangle. You’d come to know our World Class Benchmarking by this triangle which we discussed more here.
Executive Summary
We set out to examine whether our hunch was true. Were companies that outranked the competition both on profitability and growth also far superior in value gains? Secondly, were profitable growth companies better investments than companies that only ranked highly in either profits or growth?
We discovered that our hunch rang true. Not only did these companies see significantly higher value gains, they also did this 95% of the time.
Read on to see how we carried out this test and to see the full results.
Were high Profitable Growth companies also far superior in value gains?
Data
We started with our World Class Benchmarking database consisting of 27,000 companies globally. We controlled for a 20-year time span consisting of March 1997 to August 2016.
We removed financial companies and were left with 23,500 non-financial companies. We then removed 4,000 stocks that did not have the fundamental data needed for the study
Each year we only included companies with a market capitalization greater than US$500 million. To be included in any one year, the company also needed to have full-year price data in that year.
Methodology
To eliminate outliers, we excluded stocks that had a price change of more than 500% or greater than negative 80% in any one year.
This left us with on average 4,500 stocks per year (minimum in any one year = 1,500, maximum = 8,400).
We used earnings-per-share growth (EPS) as our measure of growth and return on assets (ROA) to measure profitability.
A company that was in both the top 3 deciles of EPS growth and in the top 3 deciles of ROA in each year we called a high “Profitable Growth” company.
To test across sectors and size, we created our high “Profitable Growth” portfolio combining the top 3 deciles which had the highest Profitable Growth score in every sector and from each size group.
We measured the 1-year price performance ending at each company’s closing period compared to the year before. Our high “Profitable Growth” portfolio included on average 500 stocks per year (min = 100 and max = 1,000).
We utilized this data set to solve for the following hypotheses:
- Hypothesis 1: A portfolio of High “Profitable Growth” companies in any one year also results in coincident price outperformance in that year
- Hypothesis 2: A high “Profitable Growth” portfolio beats a high profitability portfolio and also beats a high growth portfolio
Results
As you can see from the graph below, the top performing Profitable Growth companies in our study performed nearly three times better than the high growth companies.
And compared with the companies that only showed high profitability, the Profitable Growth group performed nearly four times better.
And compared with our entire universe of stocks, our hallowed group performed nearly nine times better.
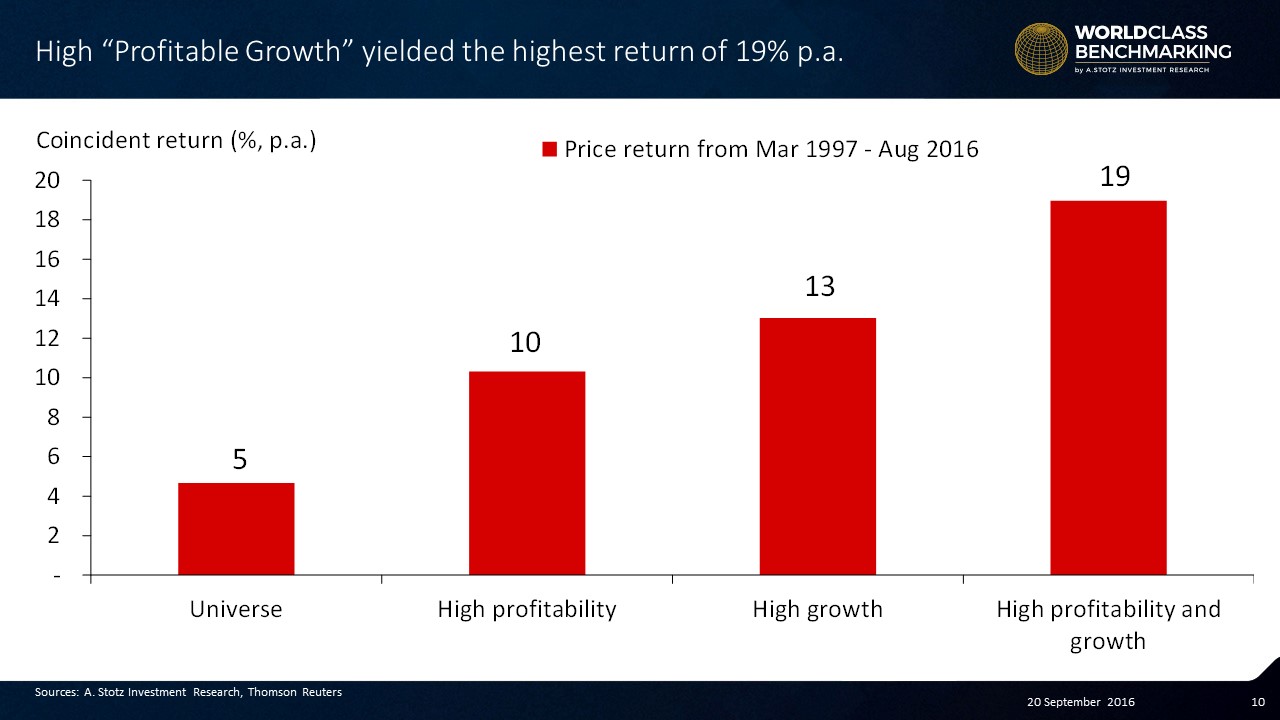
The highly profitable segment and the high growth segments turned in 10% and 13% average annual returns, respectively—excellent results in their own right. But the high Profitable Growth segment showcased an extraordinary 19% average annual gain.
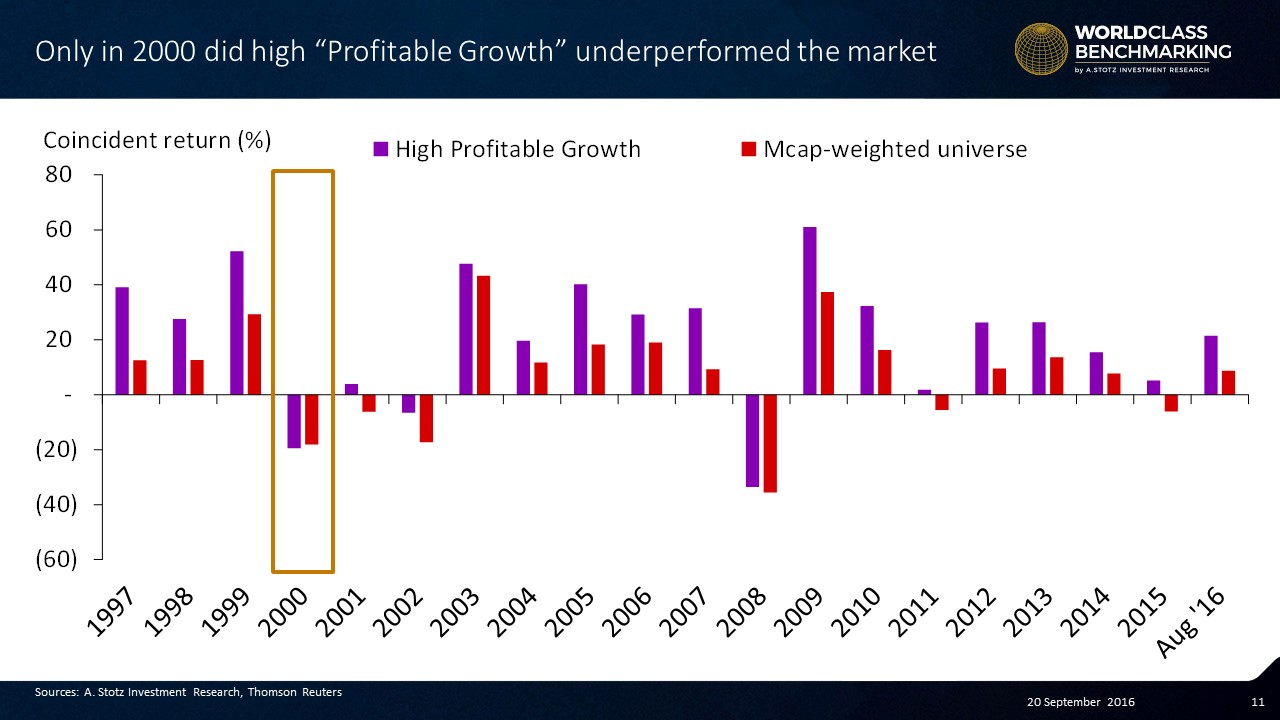
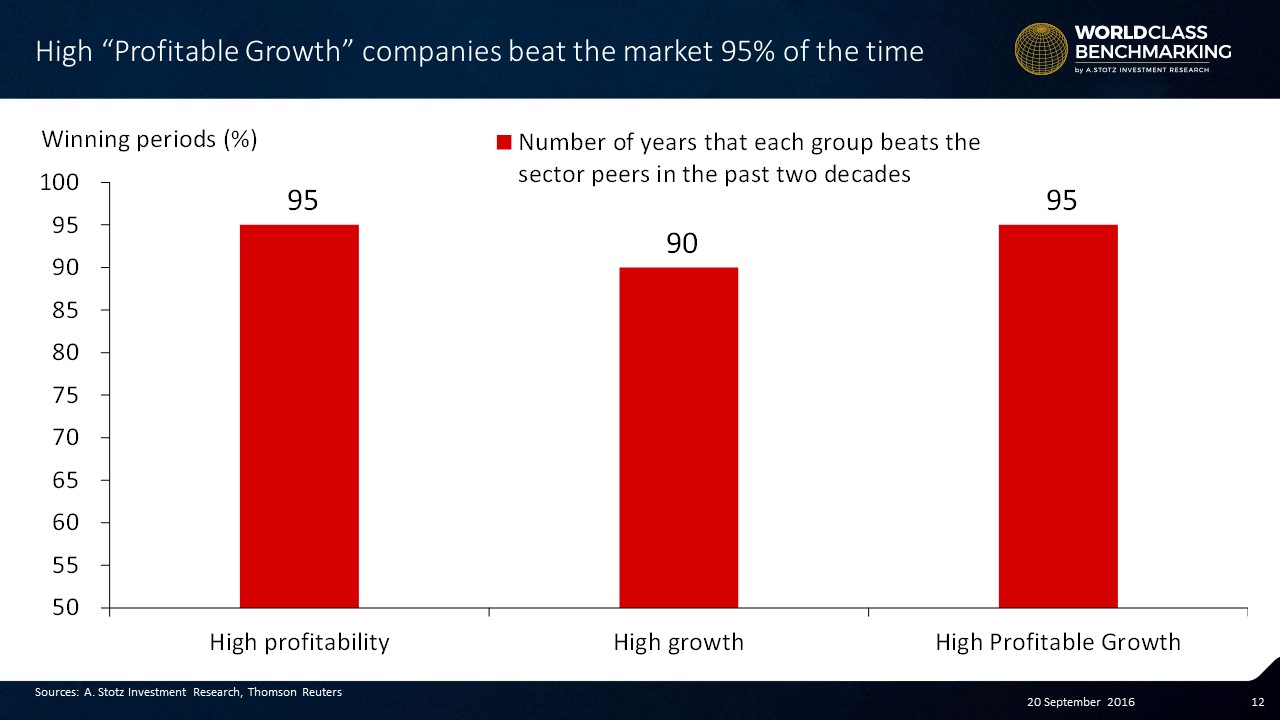
It wasn’t just a spectacular performance in the long run either. In fact, the only year this basket of stocks underperformed our total universe of stocks was in 2000.
This gives high Profitable Growth stocks a win against the market about 95% of the time.
Key Learnings: Why Profitable Growth Matters
- A portfolio of high “Profitable Growth” companies generated a return 9X higher than the market return over the past 20 years
- A portfolio of high “Profitable Growth” companies yielded the highest return of 19% per year on average
- Only in 2000 did high “Profitable Growth” companies slightly underperform the market
- A portfolio of high “Profitable Growth” companies beat the market 95% of the time
Learn more: What Is More Important, Profitability or Growth?
What do you think about World Class Benchmarking as a tool to analyze a company’s financial performance? Do you have any questions or comments about it? Would you like to see the Profitable Growth rank of the stocks in your portfolio?
We’d love to hear from you in a comment below.
Feel free to share this article with your friends.
DISCLAIMER: This content is for information purposes only. It is not intended to be investment advice. Readers should not consider statements made by the author(s) as formal recommendations and should consult their financial advisor before making any investment decisions. While the information provided is believed to be accurate, it may include errors or inaccuracies. The author(s) cannot be held liable for any actions taken as a result of reading this article.