Clustering of Best and Worst Days
Watch the video with Andrew Stotz or read the research below.
This post follows on from our previous The 10 Best Days blog post, which showed that it is very painful to be out of the market for those 10 best days.
Let’s revisit the academic-style research format that we used for this.
First, we ask a research question. Then, we review previous academic research findings relevant to our subject area. Then we formulate a hypothesis that we want to test.
We select the data set that we’re going to test this on. Is it U.S.? Is it global? We make sure that we’ve removed errors and extreme outliers that don’t really represent the overall data set.
Then we design our methodology to test the hypothesis and look at our results. Most importantly, we think about the actions that we could take to become better investors as a result of this research.
How likely it is that an investor would miss the 10 best days? That was the question that we had after we established how detrimental to terminal wealth it is to be out of the market during those days.
Question
Somebody might ask, “Why would I miss the best 10 days? Those are the days I’d want to be in the stock market.”
Well, when the market plunges on one day, it’s not uncommon that investors panic and sell.
So the question that we wanted to ask was, do bad days tend to be followed by good days? If so, these are good days that you are likely to miss if you panicked and sold the day before.
Review
Review the work that we’ve previously done, we’ve learned that missing the 10 best days can be extremely painful, causing you to lose at least 66% of your long-term gain—all that damage to return by missing just 10 days out of more than 2,000 total days.
You want to stay invested so you don’t miss these 10 best days.
Hypothesis
So, the hypothesis that we want to test is, “Is missing the 10 best days likely to occur as a consequence of panic selling?”
Data
Let’s look at our data set. We’re going to look at the same data set which we used in our prior research where we looked at the 10 best days that looks at the last 10 years in the S&P 500.
We’re going to identify the 100 best and 100 worst days, and then from those sets, we will randomly select the sets of 10 best days for our testing.
Method
We’re going to plot the 100 best and the 100 worst days on a chart, and then try to observe if there’s clustering.
If there’s clustering, what we’re going to see is that a bad day is usually followed by a good day, so the chart will show that the points will be clustered around each other, both good and bad.
If we don’t see clustering, what it would mean is that good days and bad days tend to occur independently of one another. Good days don’t show a pattern of following or preceding bad days.
Results
And here’s what we find in the research.
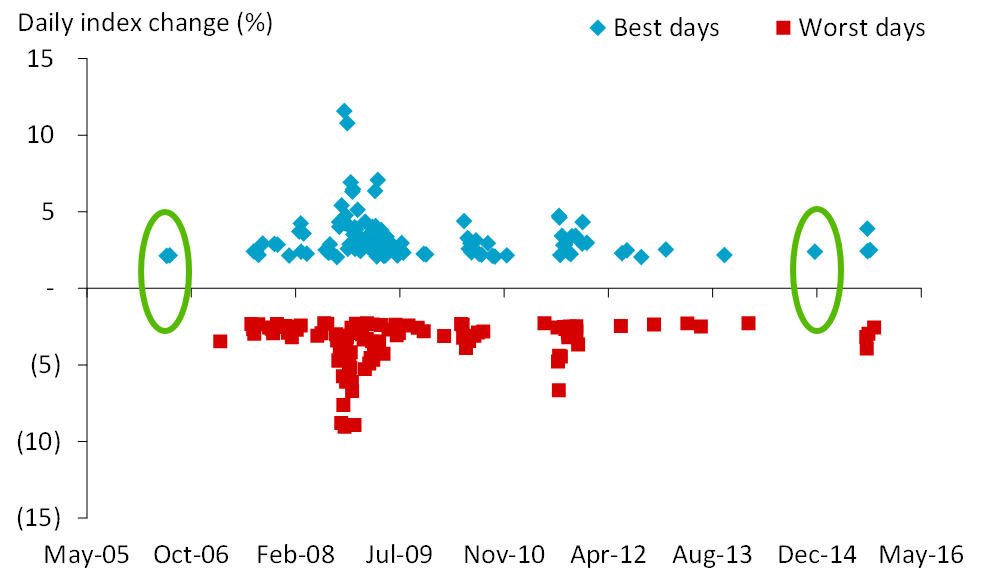
Plot of the 100 best and the 100 worst days in the past 10 years.
Basically, if we take the 100 best and worst days, best being the blue and worst being the red, we can see the there’s a lot of clustering. In fact, there’s only a small number of cases where there is movement, either up or down, in isolation.
So, what can we learn from this?
Action
- What we can learn is that the 10 best days tend to cluster around the 10 worst days
- Panic selling on these worst days, therefore, could result in missing the best days
- Unless you’re a market-timing wizard, you’re going to benefit from a long-term buy-and-hold strategy
Learn what impact missing The 10 Best Days or The 10 Worst Days have on your terminal wealth.
Are you a market-timing wizard? Have you tried to trade in and out of highly volatile markets? Share your thoughts and experiences in a comment below.
Did you like this research? Share it with your friends! It would mean a lot to us if you did, and would bring more participants in to the discussion.
DISCLAIMER: This content is for information purposes only. It is not intended to be investment advice. Readers should not consider statements made by the author(s) as formal recommendations and should consult their financial advisor before making any investment decisions. While the information provided is believed to be accurate, it may include errors or inaccuracies. The author(s) cannot be held liable for any actions taken as a result of reading this article.