Can a Price Momentum Strategy Generate Abnormal Returns?
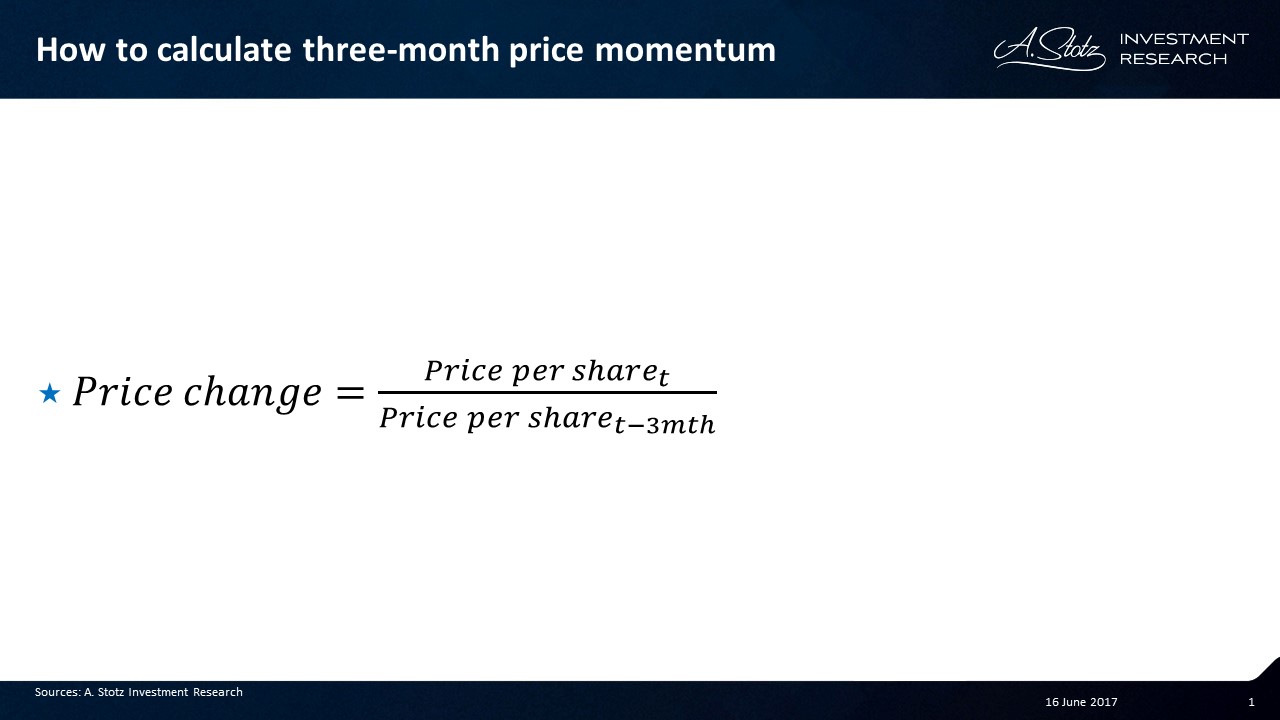
In this Academic-Style Research we tested a momentum factor, three-month price momentum, on a global universe of stocks. The three-month price momentum simply tells you how much a share price has changed over the past three months. A larger gain in share price means higher momentum and vice versa.
Hypothesis
Investing in companies with high three-month price momentum generates outperformance.
Universe
A global universe of stocks from June 2006 to April 2017. Only included companies with a minimum market cap of US$500m (no micro caps) and more than US$3m in 3MADTO (no illiquid stocks). On average, the universe consisted of 3,200 stocks per quarter.
Methodology: Testing the relationship between high price momentum and return
We winsorized at +/- 3 standard deviations to exclude outliers. Divided the universe into deciles and added two additional groups: Top 15 and Bottom 15. We calculated the equal-weighted return for each group. The groups were reselected and rebalanced each quarter. All returns are presented in US dollar terms.
Investing in high price momentum looks promising on a decile basis
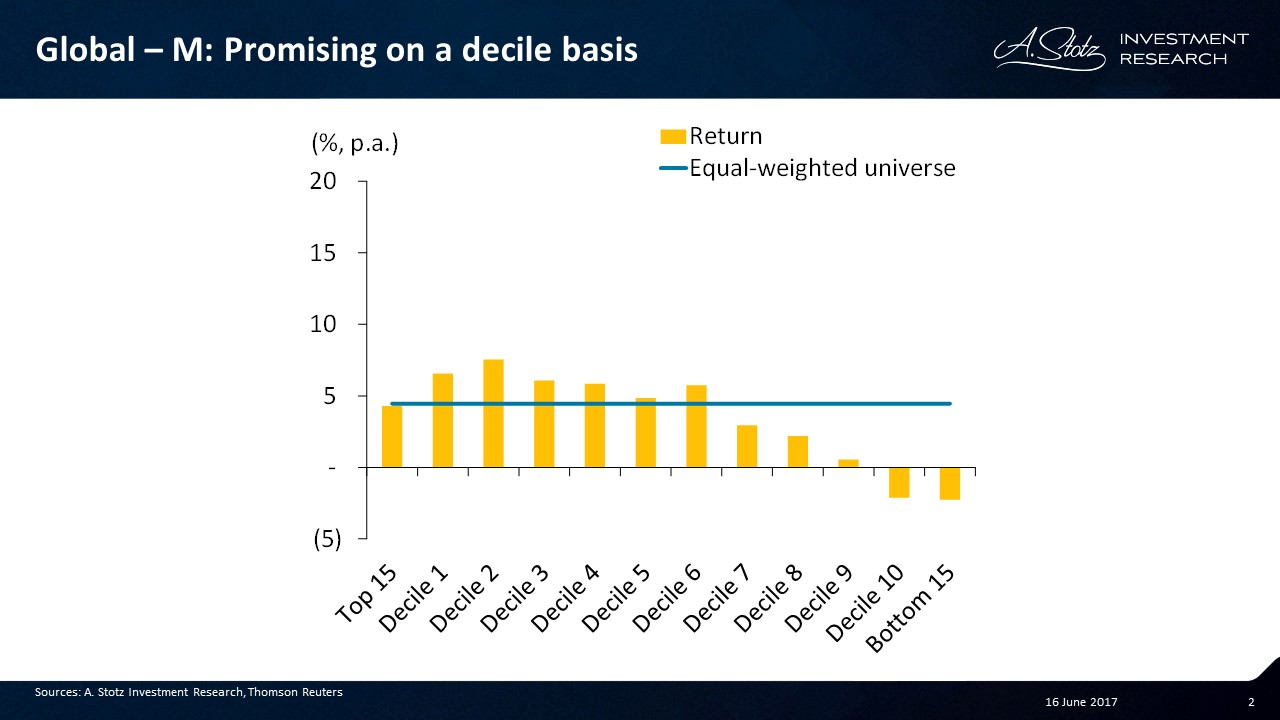
The two deciles with the highest three-month price momentum generated the highest return. Price momentum showed a clear relationship with return. Top 15 got hit by stocks with “exhausted momentum”, 55% of the stocks included in this group had a negative return.
Top 15 and Bottom 15 were both beaten
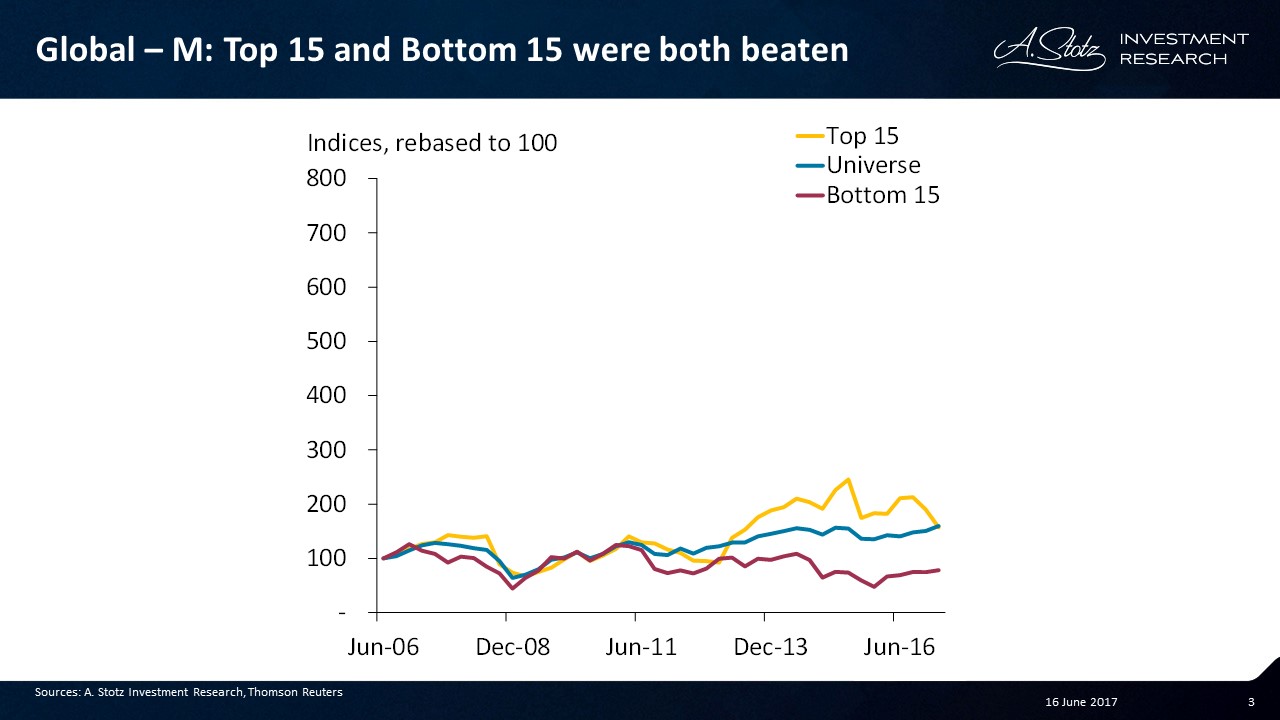
The group with the 15 highest momentum stocks had a few years of outperformance, but fell back below the universe in the last period. The Bottom 15 underperformed the universe for most of the time period investigated.
Adjusting for risk, pattern stayed the same
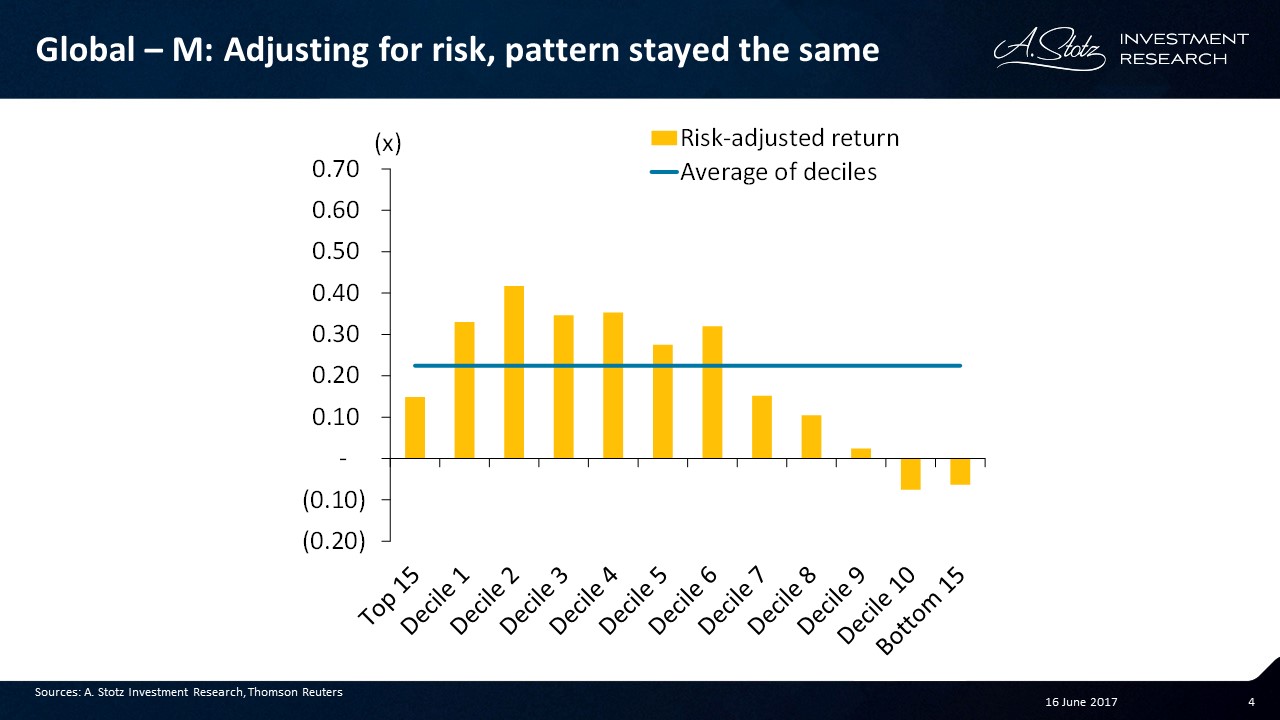
On a risk-adjusted return basis the results look about the same. Main difference was the Top 15 that showed a relatively poor risk-adjusted return due to above-market volatility. High momentum worked, but not with the top 15 stocks with the absolute highest price momentum.
Deciles 2 and 3 look good
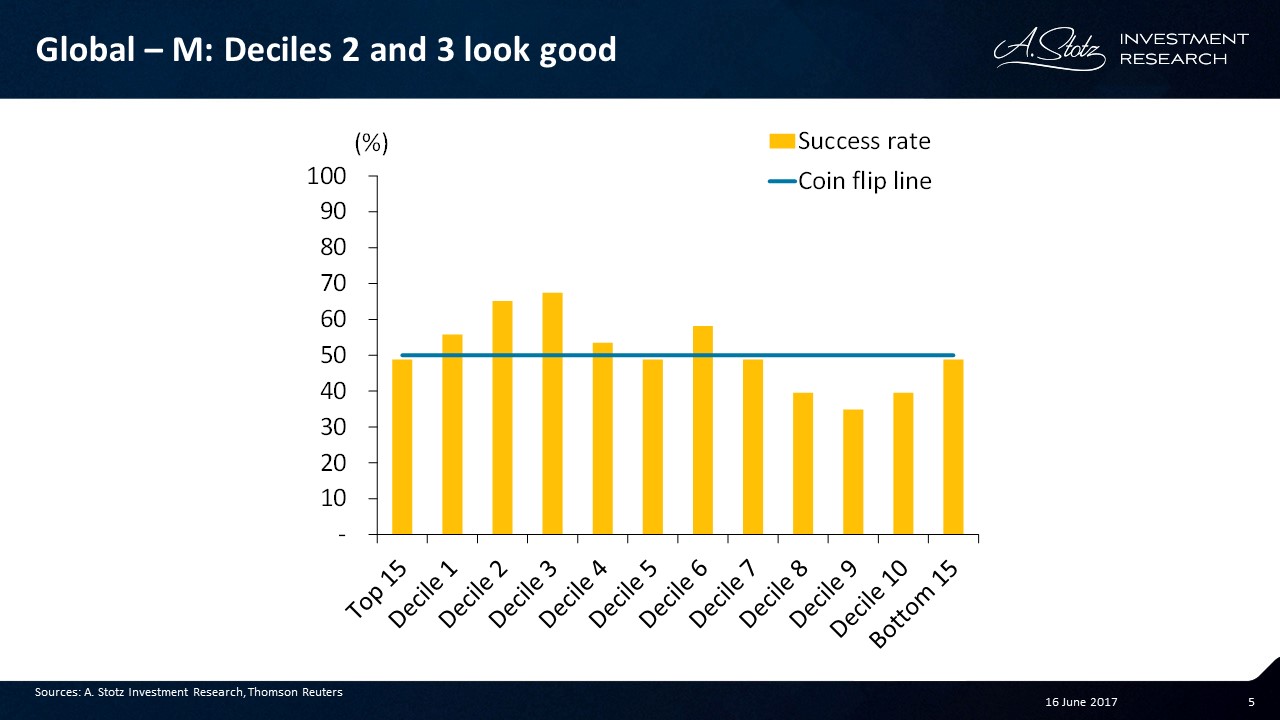
A successful quarter is when that group of stocks returned more than the equal-weighted universe. The success rate is given by the number of successful quarters divided by the total number of quarters. Decile 1 had a success rate above 50%, which is what to prefer. However, the success rate was even better for deciles 2 and 3.
Let’s combine this Momentum factor with a Fundamental and a Valuation factor
Now we’ve combined high asset turnover improvement (Fundamental factor), low PE (Valuation factor), and high three-month price momentum (Momentum factor). Check out Can Change in Asset Turnover Predict Future Return? if you want to see how the Fundamental factor did on its own and Can You Beat the Market by Investing in Low PE Stocks? to learn more about the Valuation factor.
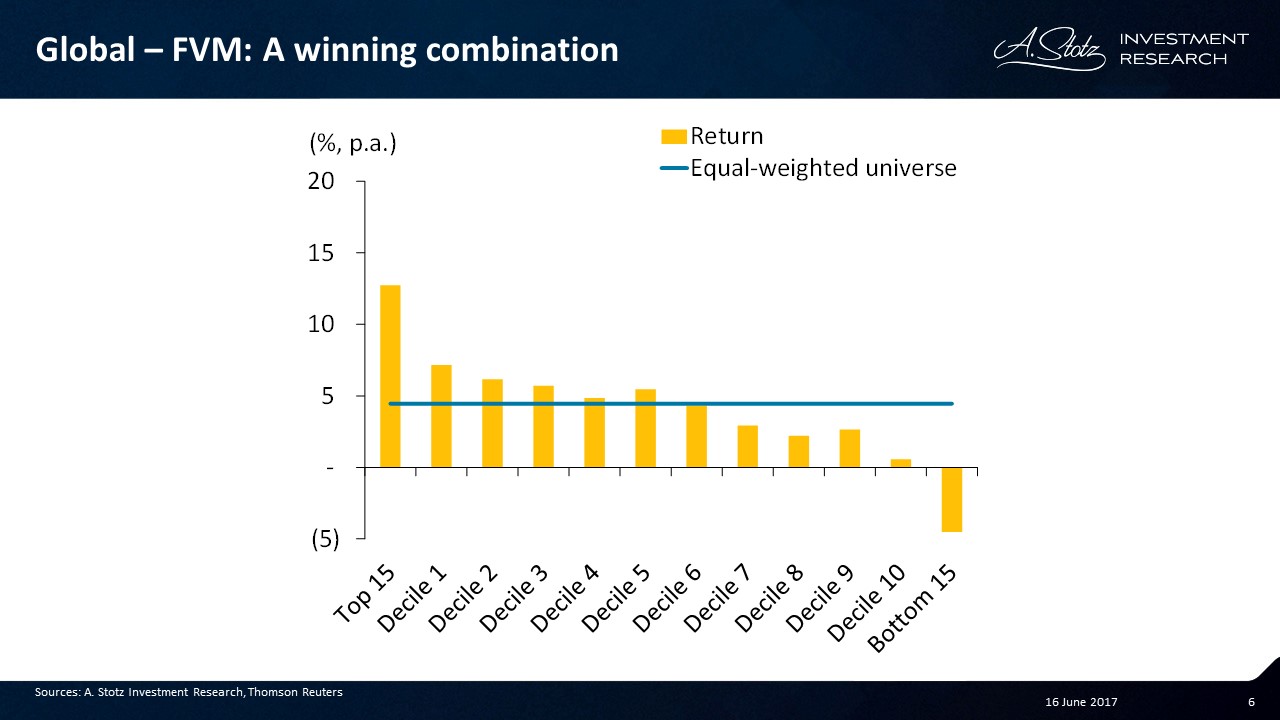
The Top 15 returned the most and the Bottom 15 the worst. Decile 1 had the highest return and deciles 1-5 beat the universe. On a return basis the combination looks successful.
Top 15 has beaten the universe since inception
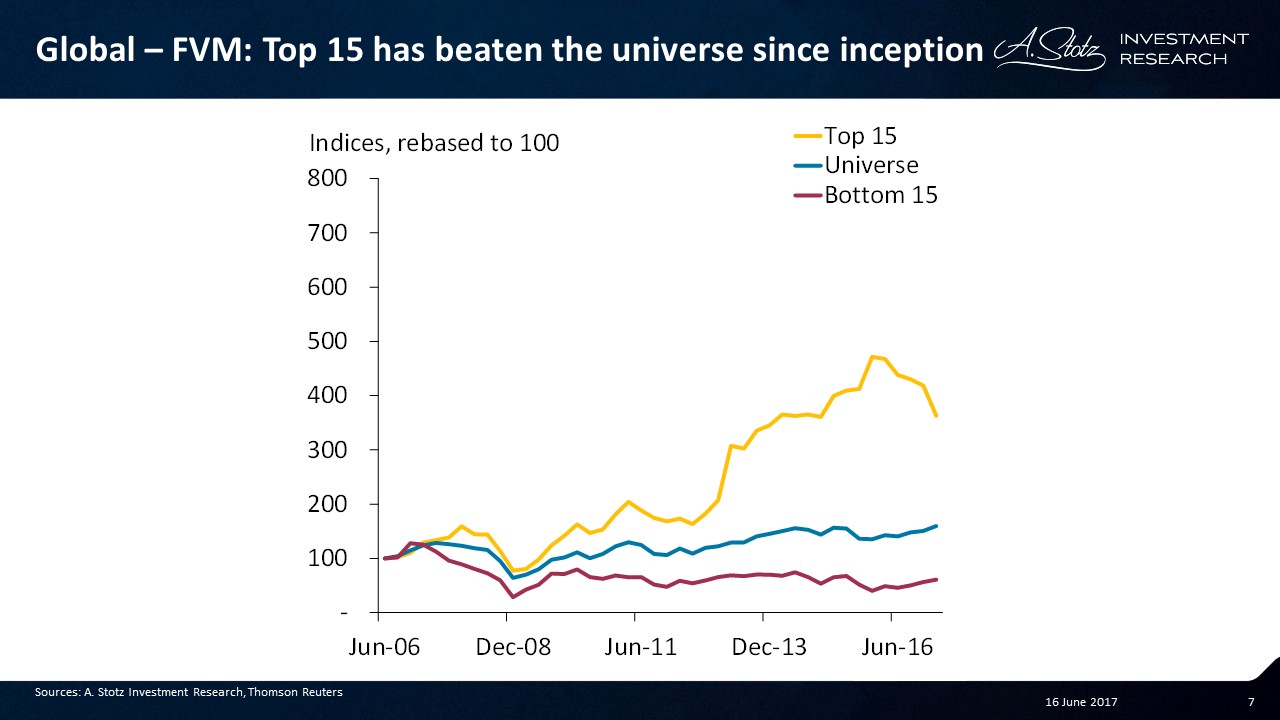
The Top 15 has beaten the universe since inception more or less. However, it has also been hit in the most recent year. The Bottom 15 has underperformed the universe continuously.
Question: Do you think a stop loss could protect against some of this downside? Let us know your thoughts in a comment below.
A winning combination on a risk-adjusted basis as well
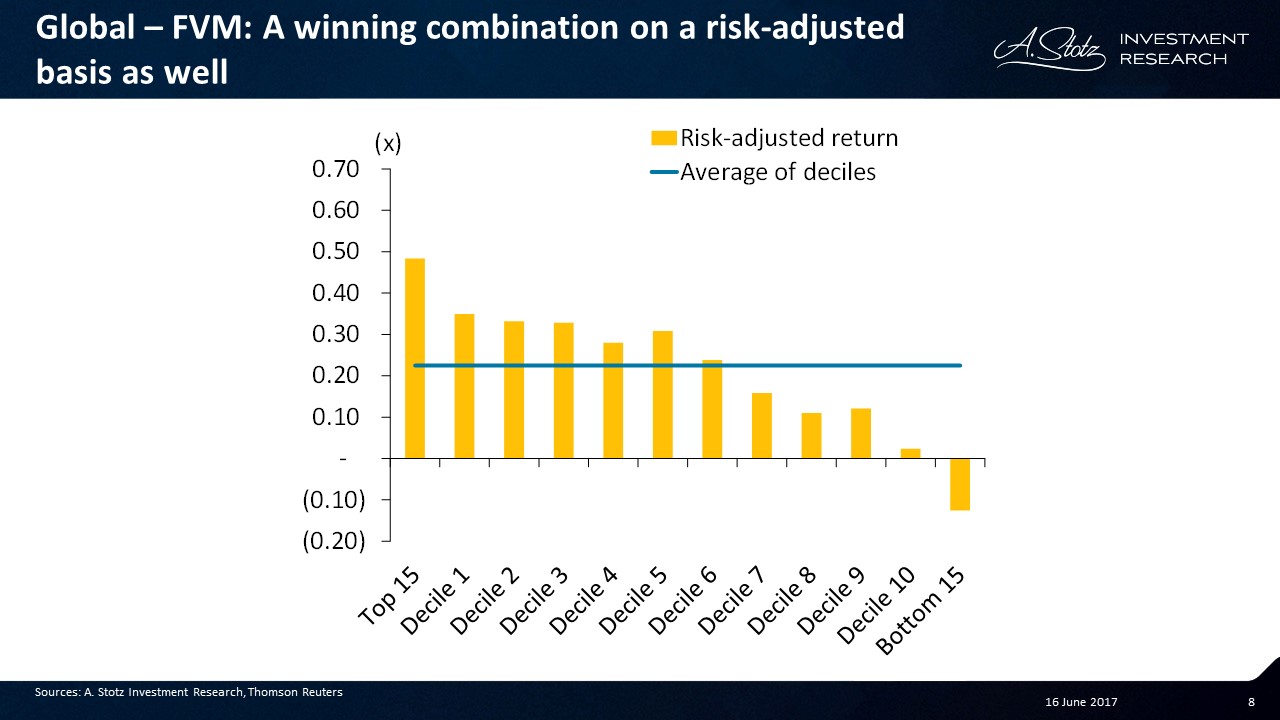
The combination was successful
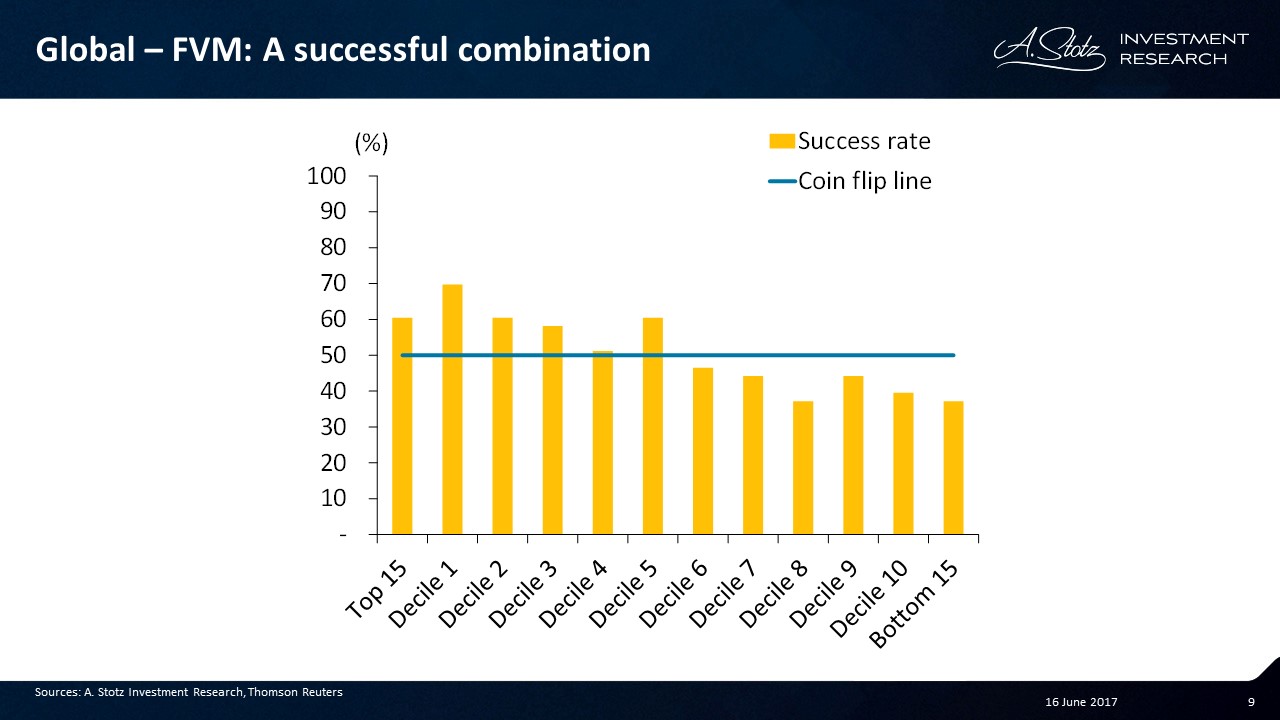
Looking at the success rate, Top 15 and deciles 1-3 showed success rates of about 60% or better. Decile 1 beat the market in 70% (!) of the quarters in the past 10 years.
What you have learned
Price momentum alone showed a good relationship with return. But it did not work for the Top 15, hence consider avoiding extremely high price momentum stocks.
When combining Fundamentals, Valuation, and Momentum, the Top 15 had the highest return followed by Decile 1. Also, deciles 1-5 beat the universe. In conclusion, a relatively successful combination of factors.
DISCLAIMER: This content is for information purposes only. It is not intended to be investment advice. Readers should not consider statements made by the author(s) as formal recommendations and should consult their financial advisor before making any investment decisions. While the information provided is believed to be accurate, it may include errors or inaccuracies. The author(s) cannot be held liable for any actions taken as a result of reading this article.