Volatility as a Predictor of Stock Market Performance
Due to the increased uncertainty in the world’s equity markets during the past year or so, a common question we’ve had from investors is whether now is the right time to invest in equity or not?
This is a hard question to answer, and there is no way to resolve it with absolute certainty, as no one can predict the future and there are many factors to consider as well. In this blog post, we’ll examine just one of those factors which may be an indicator to help us understand when is the right time to invest.
Note that this post is neither a recommendation or an attempt to answer whether this is the right time to invest in equity. It’s merely to show research that may be one piece of the puzzle towards helping you on your way to find the answer to this question. This piece being volatility.
Let’s take a look at the chart below showing World equity annual price change and the annualized volatility. Take a look at the three highlighted areas A, B, and C.
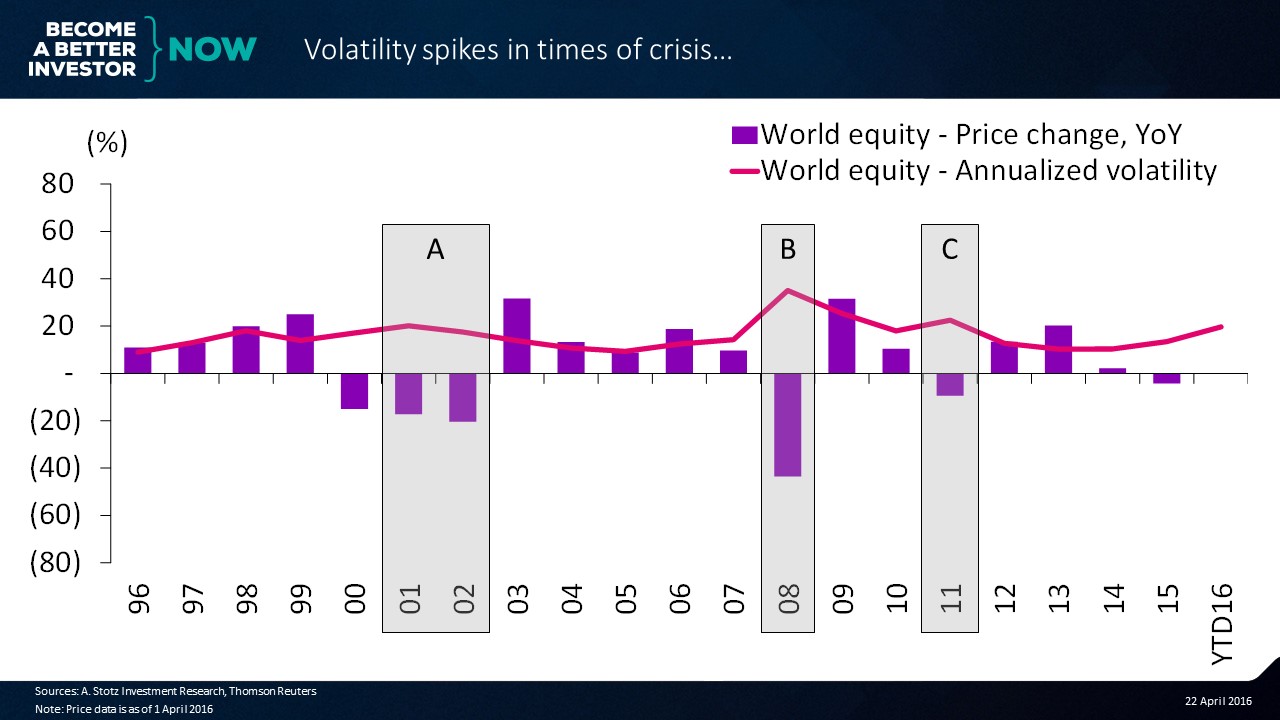
A. The dot-com bubble burst in early 2000 and crashed rapidly during 2000-2001. As you can see in the chart, volatility peaked in 2001, came down a bit during 2002 when the market bottomed out, to then decrease to lower levels as the market rebounded in 2003.
B. Volatility peaked at 35% in 2008 due to the global financial crisis. The volatility then decreased rapidly during the rebound in 2009 and bottomed out in 2010 when world equity still yielded a decent price return.
C. Fear of a spreading sovereign debt crisis in Europe caused a price fall and volatility spike in 2011. That was short lived though as volatility decreased and price returns were good in 2012 and 2013.
The chart shows a clear relationship between annualized volatility and the annual price return of World equity. In 2015 volatility started to increase again, and even more so in the year to date; 2016. Volatility is at about 60% of the level it was in the global financial crisis while it’s already at 2011 and dot-com bubble levels.
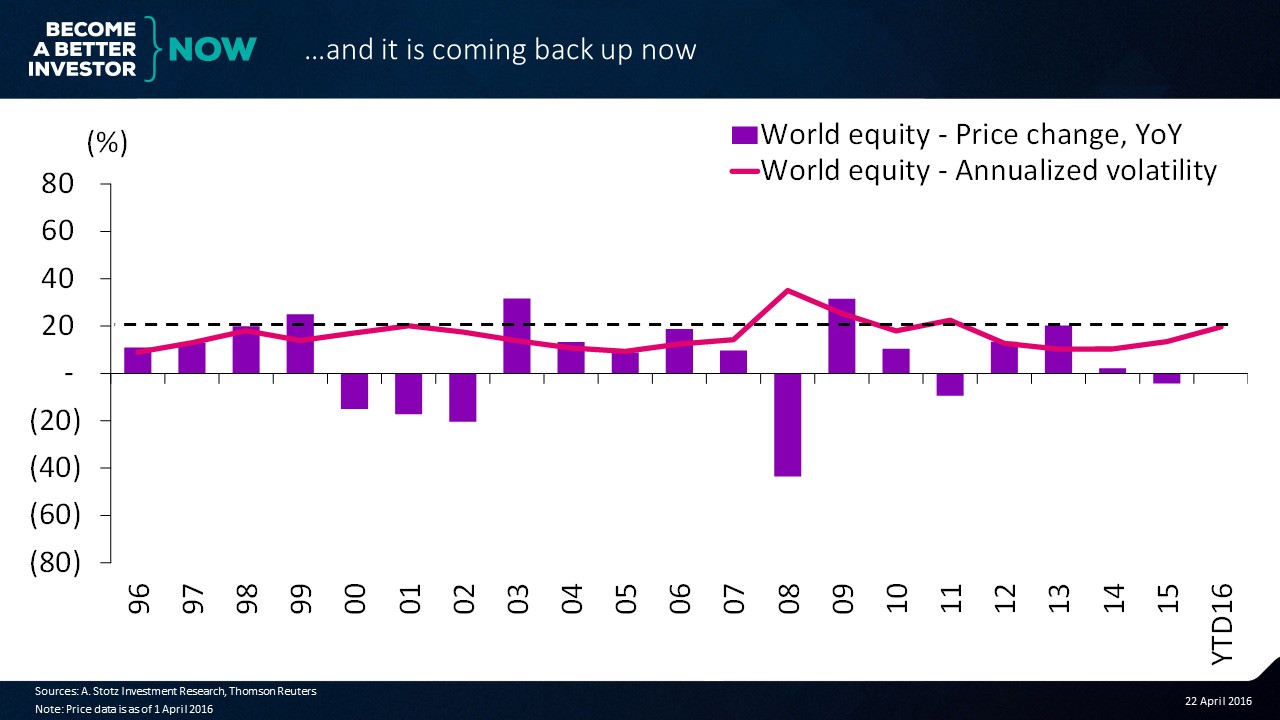
Assuming that volatility is a good indicator for equity price performance the increased volatility so far in 2016 doesn’t tell us when the market will turn. However, the current high volatility suggests we’re on our way to a turn and if that happens, it should have a positive impact on the price of World equity if we look at its history.
DISCLAIMER: This content is for information purposes only. It is not intended to be investment advice. Readers should not consider statements made by the author(s) as formal recommendations and should consult their financial advisor before making any investment decisions. While the information provided is believed to be accurate, it may include errors or inaccuracies. The author(s) cannot be held liable for any actions taken as a result of reading this article.