Top Glove Maker’s Steady Improvement in Profitable Growth
Watch the video with Andrew Stotz or read a summary of the World Class Benchmarking on Top Glove Corporation Berhad.
Background
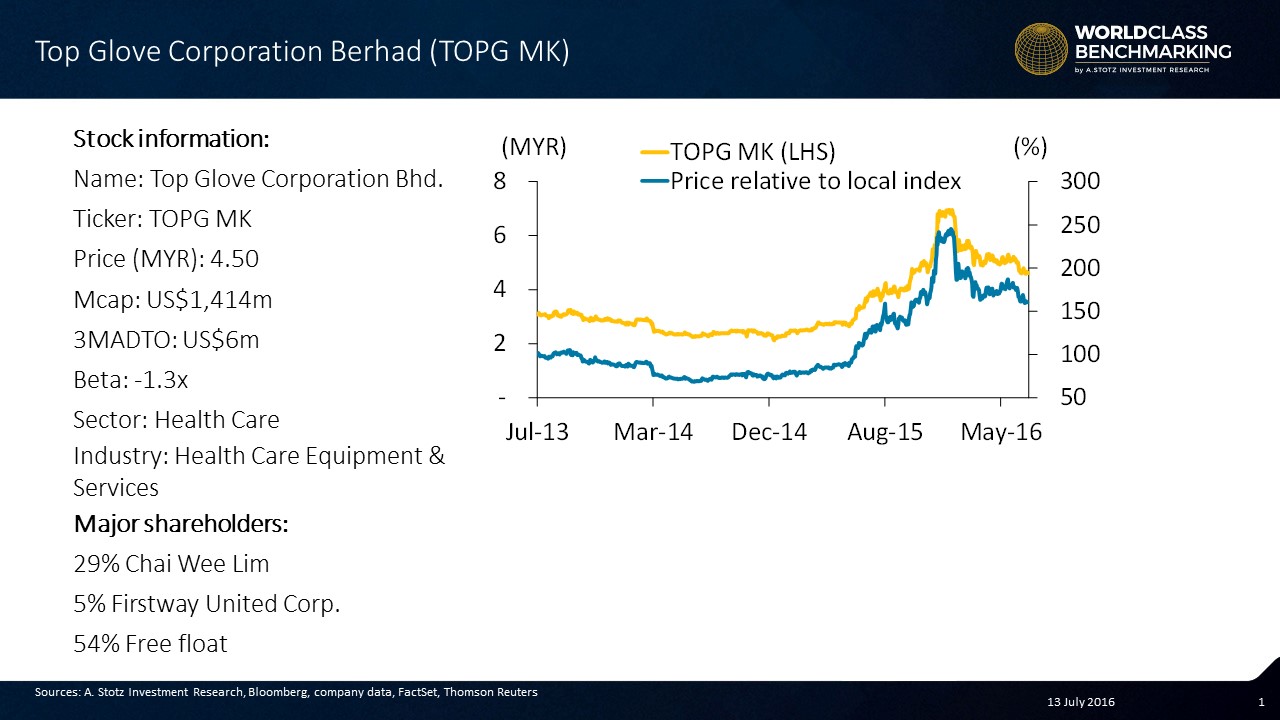
Top Glove Corporation Berhad (TOPG) is the world’s largest rubber glove maker by annual production capacity. Based in Malaysia, with offices in six countries (in Asia, Europe, and the Americas). It exports to 195 countries.
About 80% of its production is sold to the Health Care sector.
Business Description
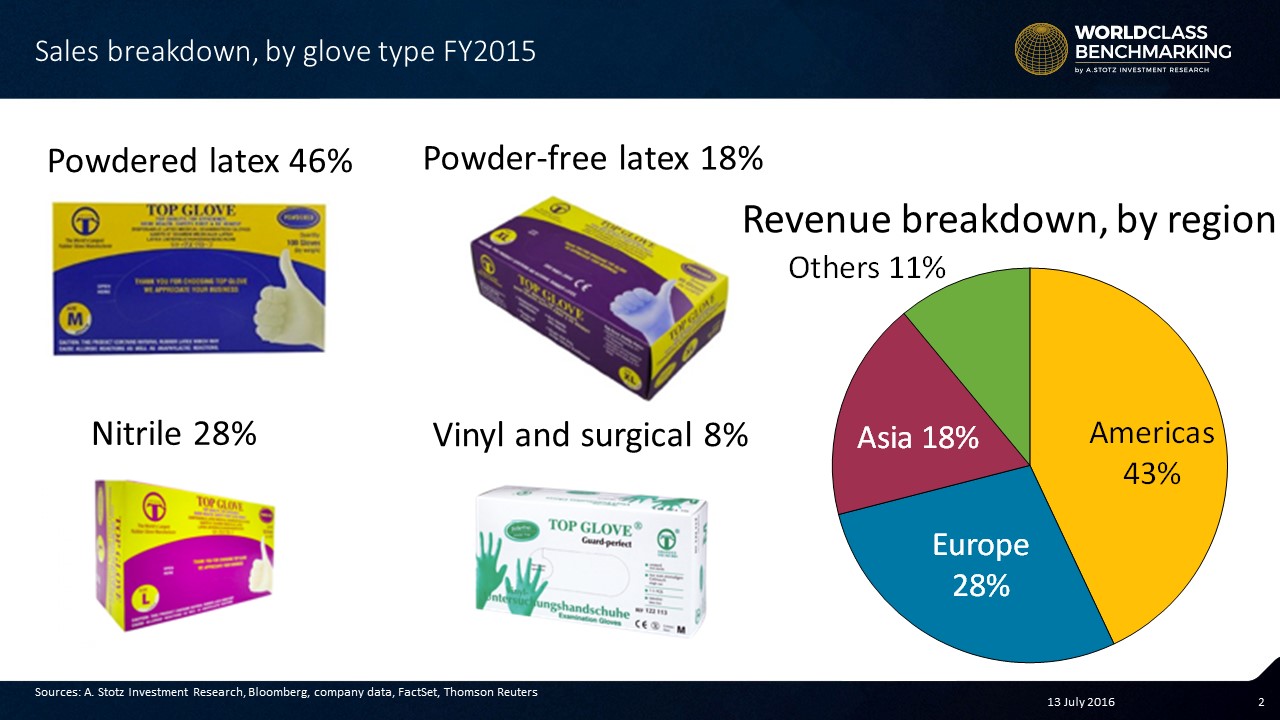
TOPG currently has 12 products that fall under five categories: Powder-free latex, powdered latex, nitrile, vinyl and surgical. Together they cover gloves for household, surgical and industrial use. Most of TOPG’s products come in five different sizes and the majority of its annual production is sold to the Health Care sector.
It owns and operates 27 factories in Malaysia, Thailand, and China, with a total of 484 production lines and 45bn pieces in annual capacity. TOPG has been emphasizing automation development in manufacturing to optimize efficiency, and focusing on innovation and extensive R&D.
Confident in future demand for rubber gloves, it has also been seeking M&A opportunities, domestically and internationally.
TOPG plans to finish construction and open three factories, two in Malaysia and the other in Thailand, which will add about 8bn pieces in annual capacity upon completion expected throughout 3Q16 to 1Q17.
World Class Benchmarking
See an updated World Class Benchmarking scorecard here.
Profitable Growth improved to #1 from #2 in the past 12 months. This means TOPG ranks better than 378 of 420 medium Health Care companies globally.
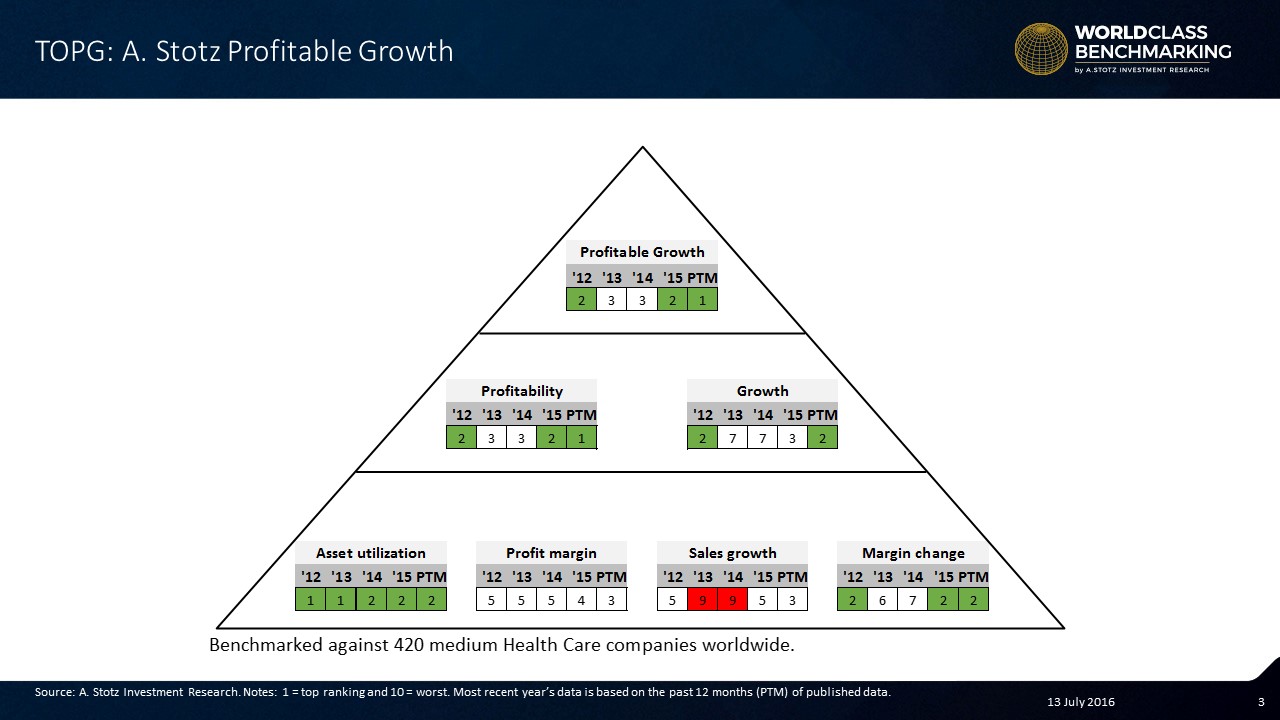
Profitability in terms of ROA improved to #1 from #2 and is now ranked among the best 42 globally. Growth improved further to #2 from #3.
Profit margin improved to #3 from #4 and drove up the Profitability rank. Sales growth improved to #3 from #5 and was the driver of Growth.
Do YOU want to see the Profitable Growth rank for a company in YOUR portfolio?
Leave a comment below and we’ll post it if we have it.
DISCLAIMER: This content is for information purposes only. It is not intended to be investment advice. Readers should not consider statements made by the author(s) as formal recommendations and should consult their financial advisor before making any investment decisions. While the information provided is believed to be accurate, it may include errors or inaccuracies. The author(s) cannot be held liable for any actions taken as a result of reading this article.