Is There a Value Premium?
Introduction
The value versus growth debate is endless. Value and growth styles tend to move in cycles, sometime in or out of favor. The value premium, return on value stocks minus return on growth stocks, varies across time and markets.
“If we assume that it is the habit of the market to overvalue common stocks which have been showing excellent growth or are glamorous for some other reason, it is logical to expect that it will undervalue—relatively, at least—companies that are out of favor because of unsatisfactory developments of a temporary nature.” – Benjamin Graham

Our academic-style research format
- Ask a research question
- Summarize previous research
- Formulate a hypothesis to test
- Select a relevant data set, remove errors and outliers
- Formulate a methodology to test the hypothesis
- Present and analyze the results
- Advise on how to apply to improve investment decisions
Questions
Let’s test these research questions
- Is there a value premium?
- Is the value premium persistent over time?
Review
Investors prefer growth stocks, even though value outperforms
In Contrarian Investment, Extrapolation, and Risk, Lakonishok, Shleifer, Vishny (1994) looked at US stocks, Apr 1963 to Apr 1990; measured performance from April 1968 as some portfolios required 5 years of data. Value beat growth over the period 1968-1990 and value outperformed growth in 17 out of 22 years. Growth stocks get overhyped from improvements in fundamentals leading to high expectations which are later not met.
The value premium can not be explained by traditional risk measures such as volatility. More likely is that investors get more excited about growth stocks stories vs. value stocks:
- Judgment error based on extrapolation of past growth rates that are unlikely to be sustained
- Equating “good companies” with a “good stock”
- Too short time frames, e.g., can’t handle that a strategy takes 3-5 years to pay off where some years underperform
Early global evidence for the value premium
Fama & French (1998), in their paper Value versus Growth: The International Evidence, looked at the period from 1975 through 1995 in US, Japan, UK, France, Germany, Italy, Netherlands, Belgium, Switzerland, Sweden, Australia, Hong Kong, Singapore. For global value-weighted portfolios of stocks, Fama & French tested value versus growth based on four different measures.
Value stocks were defined as the 30% of the universe with the highest Book yield (B/M), Earnings yield (E/P), Cash flow yield (C/P), or Dividend yield (D/P), and Growth stocks were defined as the 30% with the lowest B/M, E/P, C/P, or D/P.
The B/M factor showed the largest outperformance and difference. Value stocks defined as the 30% of stocks with the highest B/M generated 14.76% per annum or 5.16% outperformance relative to the market’s 9.60% per annum. All markets except Italy, 12 out of 13, showed evidence for the value premium.
The value premium is mainly found in stocks accounting for only 7% of market cap
Phalippou’s (2008) paper, Where Is the Value Premium?, looked at US stocks from July 1980 through December 2001. Grouped into deciles based on institutional ownership and found that the value premium was largest in value stocks with the lowest institutional ownership. These value stocks only accounted for 7% of the total market capitalization, hence, costly to arbitrage away.
Value premium exists across valuation metrics, regions, and size
The Brandes Institute’s (2015) publication, Value vs. Glamour: A Long-Term Worldwide Perspective, looked at data from 1980 to 2014 and compare the US, Developed non-US (22 countries), and Emerging markets, excluded 50% of stocks with the lowest market cap. Defined value versus growth based on P/E, P/B, and P/CF. In Developed markets, P/CF showed the largest value premium. In Emerging markets, P/B showed the largest value premium.
For P/B, the difference between the cheapest decile (value) minus the most expensive decile (growth) showed a difference of:
- 15.13% per annum in Emerging markets
- 7.89% in Developed non-US
- 4.55% in the US
Found evidence for the value premium across valuation metrics, regions, and size.
Value outperforms due to actual recovery in fundamentals
In Factors from Scratch: A look back, and forward, at how, when, and why factors work by Livermore, Meredith & O’Shaughnessy (2018), equal-weighted quintiles of US large caps were constructed and tested from June 1964 through October 2017. With annual rebalancing, value outperformed S&P 500 by 4.80% per annum. Extended it to rebalancing each decade, the outperformance fell to 1.65% per annum.
Stocks experiencing weak fundamentals get priced cheaper by the market. During the 1-year holding period, fundamentals aren’t improving but the market becomes less pessimistic about future returns; hence pushing up the price and valuation. The market has first imposed an excessive discount and the value strategy benefits from the tightening of that discount.
Hypotheses
- The value premium exists across regions and markets
- The value premium is persistent over time
Data
Looked over 25 years across regions and Asian markets
Looked at the period from 31 December 1994 to 11 September 2019.
We broke the world into five regions:
- Developed Europe, Emerging markets, US, Japan, and Asia ex Japan
Also, considered individual Asian markets:
- China, Hong Kong, India, Indonesia, Korea, Malaysia, Philippines, Singapore, Taiwan, and Thailand
Used MSCI’s value and growth indices
We used total return for MSCI’s value and growth indices; MSCI splits an index into two parts representing 50% of the underlying index based on their definitions. MSCI calculates z-scores and when a stock exhibits both value and growth characteristics, the stock gets partially allocated to both indices–the sum of the value and growth indices should equal the underlying index.
MSCI’s value characteristic:
- Book value-to-price (B/P)
- 12-month forward earnings yield (Fwd E/P)
- Dividend yield (D/P)
MSCI’s growth characteristic:
- Long-term forward earnings per share (EPS) growth
- Short-term forward EPS growth
- Current internal growth rate
- Long-term historical EPS growth trend
- Long-term historical sales per share growth trend
Method
Looked at the total return for value minus growth indices for various time horizons. A positive number means there was a value premium–the larger difference, the more substantial value premium.
Results
No value premium in Developed Europe and the US over the past 25 years
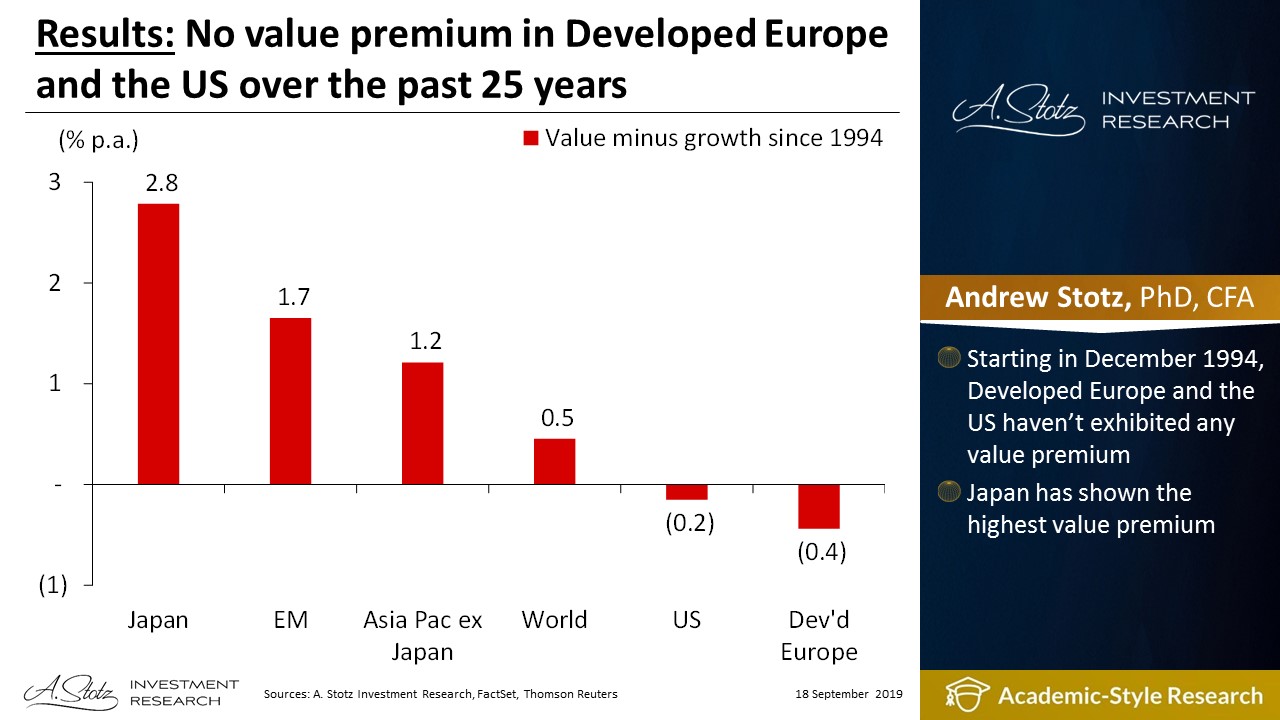
Starting in December 1994, Developed Europe and the US haven’t exhibited any value premium. Japan has shown the highest value premium.
No value premium in the past 10 years
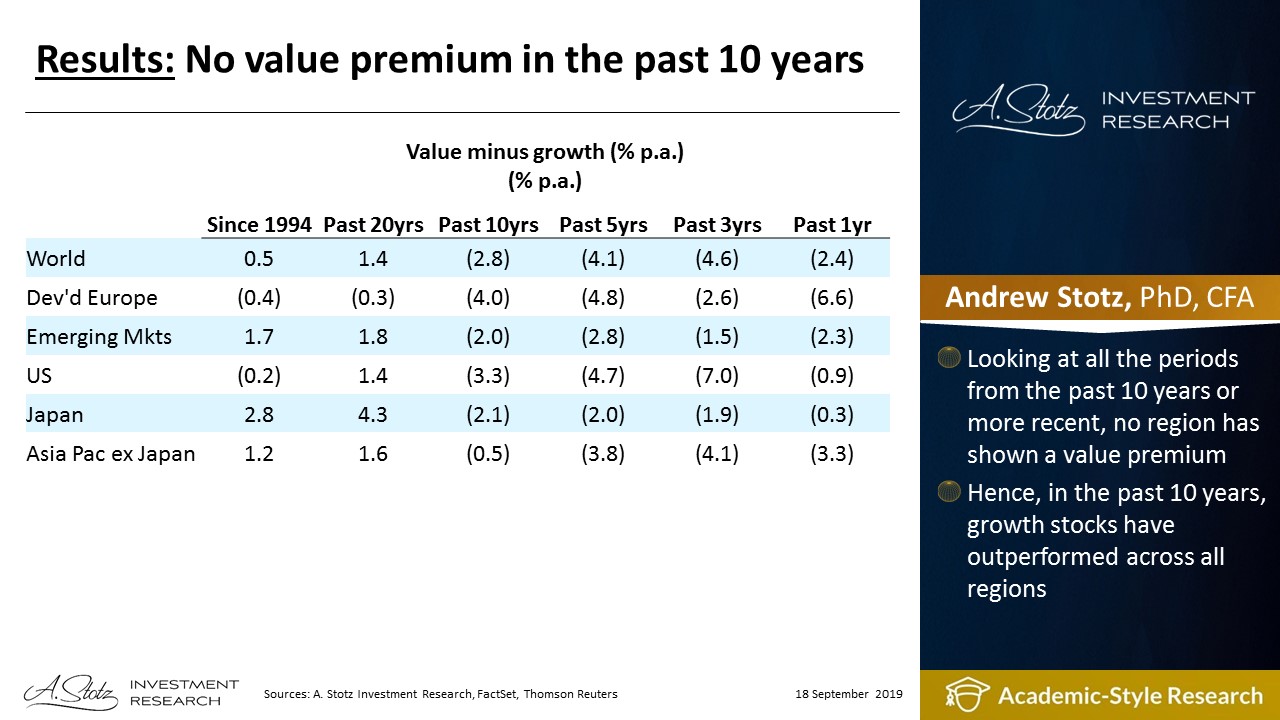
Looking at all the periods from the past 10 years or more recent, no region has shown a value premium. Hence, in the past 10 years, growth stocks have outperformed across all regions.
Value premium in most Asian markets, considering the past 25 years
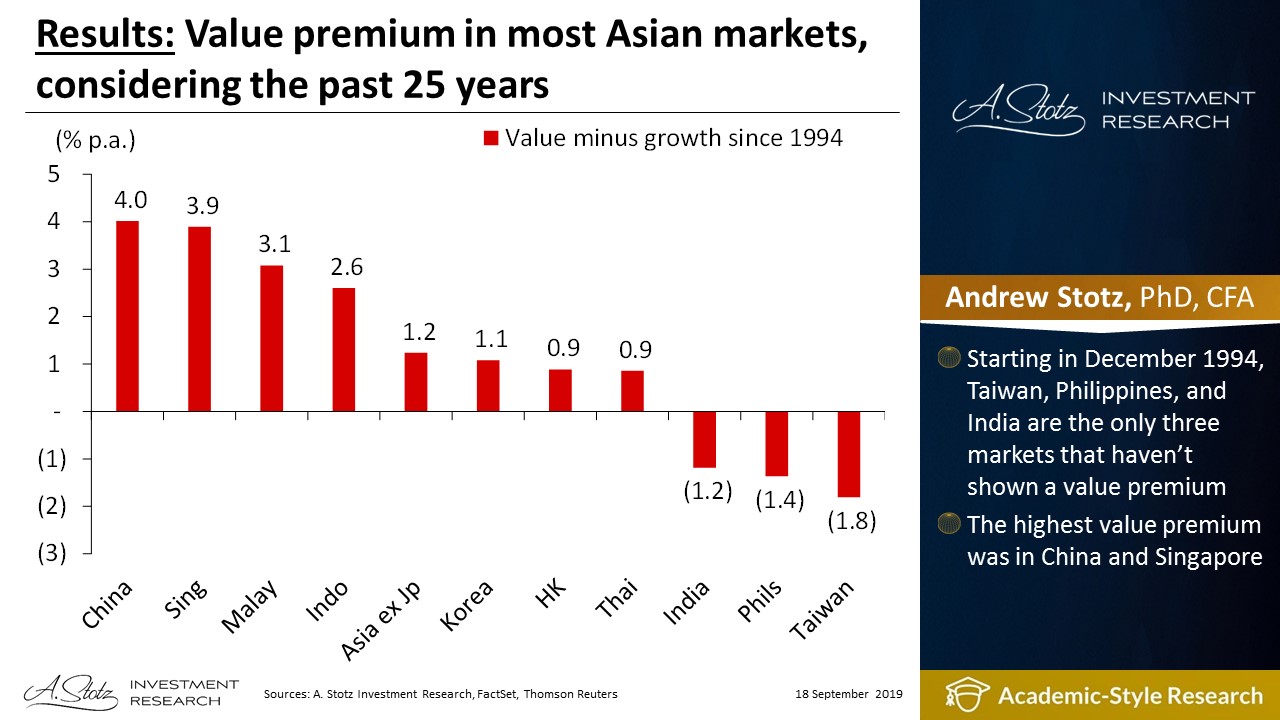
Starting in December 1994, Taiwan, Philippines, and India are the only three markets that haven’t shown a value premium. The highest value premium was in China and Singapore.
Value premium only in Singapore in the past 10 years
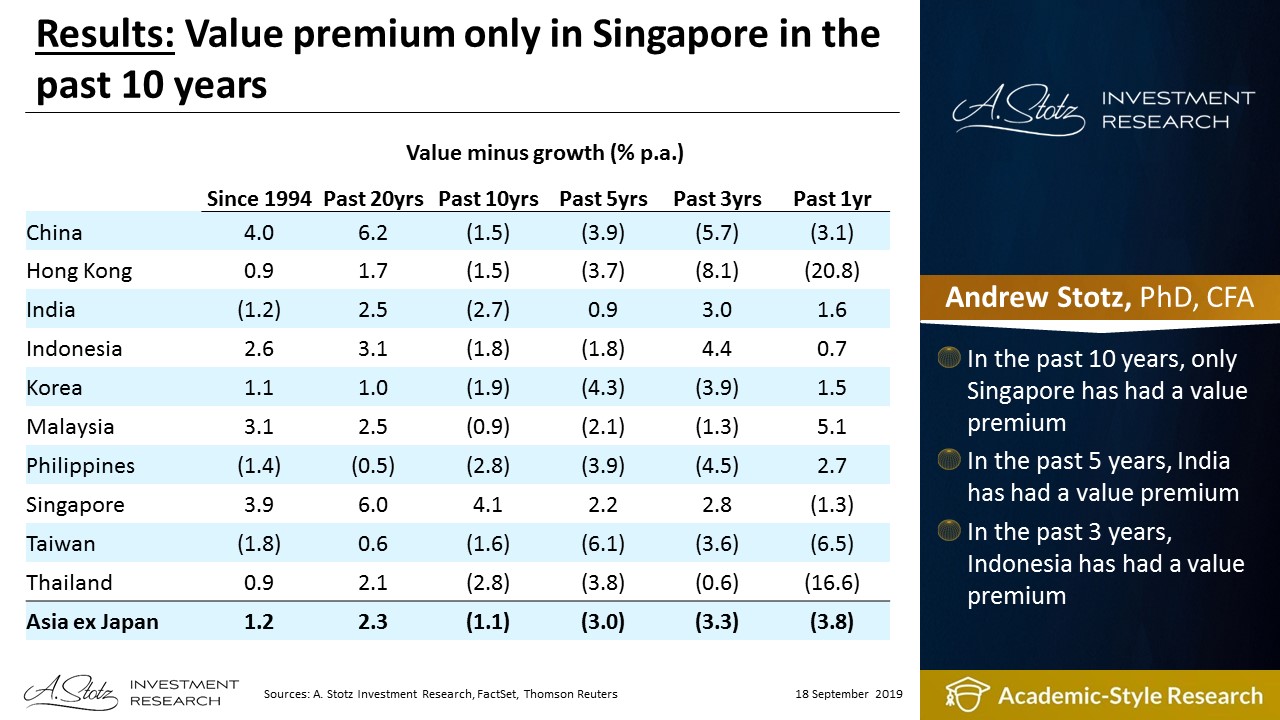
In the past 10 years, only Singapore has had a value premium. In the past 5 years, India has had a value premium. In the past 3 years, Indonesia has had a value premium.
Action
Since 1994, most regions and Asian markets have had a value premium. However, in the past 10 years, we’ve seen an extraordinary bull market where growth has beaten value in most periods. Might be time for value to start outperforming.