Buy and Hold Is Boring but Solid
Introduction
There are many advocates of buy and hold. There’s also a lot of evidence to support it is a sound long-term strategy. At the same time, most people interested in investing and professional investors are trying to time the market.
When timing the market, you’d try to avoid being invested or even short the market when the market is down. You then want to be in the market or even leverage a long position when the market is going up. Let’s keep it simple, you want to miss the worst days and you don’t want to miss the best days.
This is something we’d all like to do, but remember, it’s very hard (most likely impossible) to predict these best and worst days accurately. Trying to time the market then means you’re adding at least one risk versus buy and hold; that you’re in/out of the market at the wrong time.
In this Academic-Style Research, we’ll look at the impact on your terminal wealth from:
- Missing the 10 WORST days in 10 years
- Missing the 10 BEST days in 10 years
And why you could end up being in the market on a worst day AND missing a best day.
Our academic-style research format
- Ask a research question
- Summarize previous research
- Formulate a hypothesis to test
- Select a relevant data set, remove errors and outliers
- Formulate a methodology to test the hypothesis
- Present and analyze the results
- Advise on how to apply to improve investment decisions
Questions
Let’s test these research questions
- What impact would missing the 10 WORST-return days in a 10-year period have on terminal wealth?
- What impact would missing the 10 BEST-return days in a 10-year period have on terminal wealth?
- Why would an investor miss the 10 best days?
Review
We looked at Seyhun’s 2003 paper. He calculated US returns over a long (1926-1993) and a medium-term (1963-1993) period of time. He found: missing the 12 best months reduced terminal wealth by 86%; missing the 10 best days reduced terminal wealth by 38%; and missing the 10 worst days increased return by 92%.
Trying and failing to time the market is what is most likely to happen to investors, and when that happens, it hurts returns massively.
In 2004, Johnson & Krueger did a study of dollar-cost averaging and market timing. Using daily returns of the S&P 500 from 1982-2001, they found that missing the 10-50 best days decreases annual returns by 24%-80%, and missing the combination of both the best and the worst days increases annual return by about 15%.
We’re not trying to think about “What trading strategy could do this?” because it would be extremely hard to figure out. The key point is that we should not be trading in and out of the market. So avoid market timing. Dollar-cost averaging can help do just that.
In 2009, Estrada found that from 1900-2006, missing the 10 best days would have resulted in a 65% lower portfolio value, and missing the 10 worst days would have resulted in a 206% higher portfolio value.
Again, the odds are stacked massively against your timing it right, because 10 days out of the period from 1900 to 2006 account for a minuscule 0.03% of total days.
Estrada then looked at 16 emerging markets and 110,000 daily returns. He found that missing the 10 best days would result in a 69% lower portfolio value and missing the 10 worst days would result in a 337% higher value; these extreme values are due to emerging markets being so much more volatile than developed markets such as those in the U.S.
Once more, it would be extraordinarily difficult to get the ideal timing right, because 10 days out of 110,000 are only about 0.15% of total days.
In 2011, Faber looked at S&P 500 returns from 1928 to 2010 and saw that extreme days had the same impact. He found that 60%-80% of the best and worst days occurred in declining markets, which he defined as markets that were below their 200-day simple moving average.
His research suggested that investors can time the market to some extent by being out of declining markets. So I think that insomuch as you can accurately gauge momentum turning against the market and against you, being out of it at that time could be beneficial.
Hypotheses
- Missing the 10 WORST days will significantly INCREASE terminal wealth over a 10-year investment horizon
- Missing the 10 BEST days will significantly DECREASE terminal wealth over a 10-year investment horizon
- Investors are likely to miss the best days due to panic selling on worst days as the best and worst days are clustered
Data
Gathered the time series of daily prices of the MSCI AC World index for the past 10 years (about 2,600 trading days). The last date in the time series was 10 April 2019.
Method
We calculated the daily percentage change. We identified the 100 best and 100 worst daily returns, and then we invested in the market but removed 10 randomly selected best or worst days, resulting in a 0% return for those days. We repeated this process 100 times and looked at the average, maximum and minimum terminal wealth. Compared the outcome to a buy-and-hold strategy.
In an active strategy, the probability of you actually being out of the market on the exact 10 best or worst days is unlikely, which is why we chose our 10-day sets randomly.
Let’s look at exactly how we executed our hypothetical trading day on the 10 days we were out of the market. We’ll call one of those random days “Day Zero”.
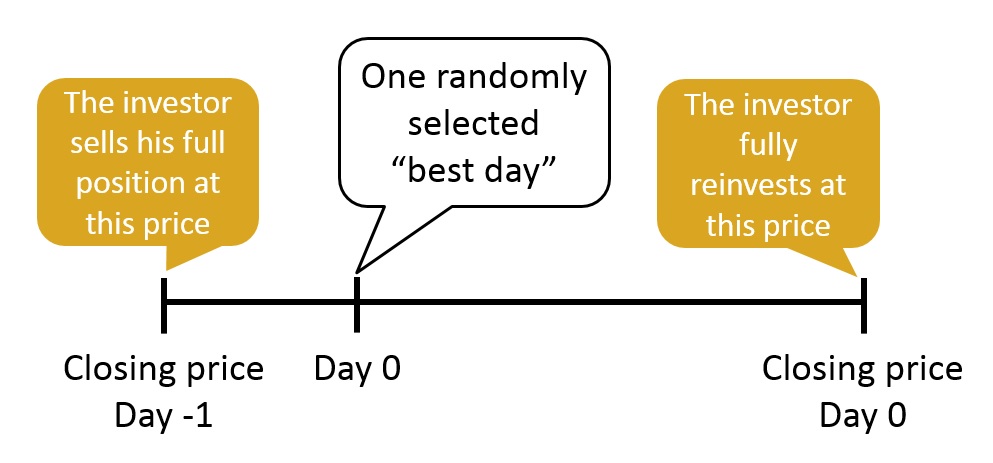
We sold our full portfolio position just before Day Zero. And then, right after it, reinvested at the closing price. So we missed that day entirely.
How likely is it that an investor misses the 10 best days? Well, when the market plunges one day it’s not uncommon that investors sell in panic. Hence, missing the best days is likely to occur as a consequence of panic selling on a worst day.
To test this hypothesis we plot the 100 best and the 100 worst days. Then observe whether good days and bad days are clustered around each other.
Results
Over the past 10 years, world equity has returned 139%
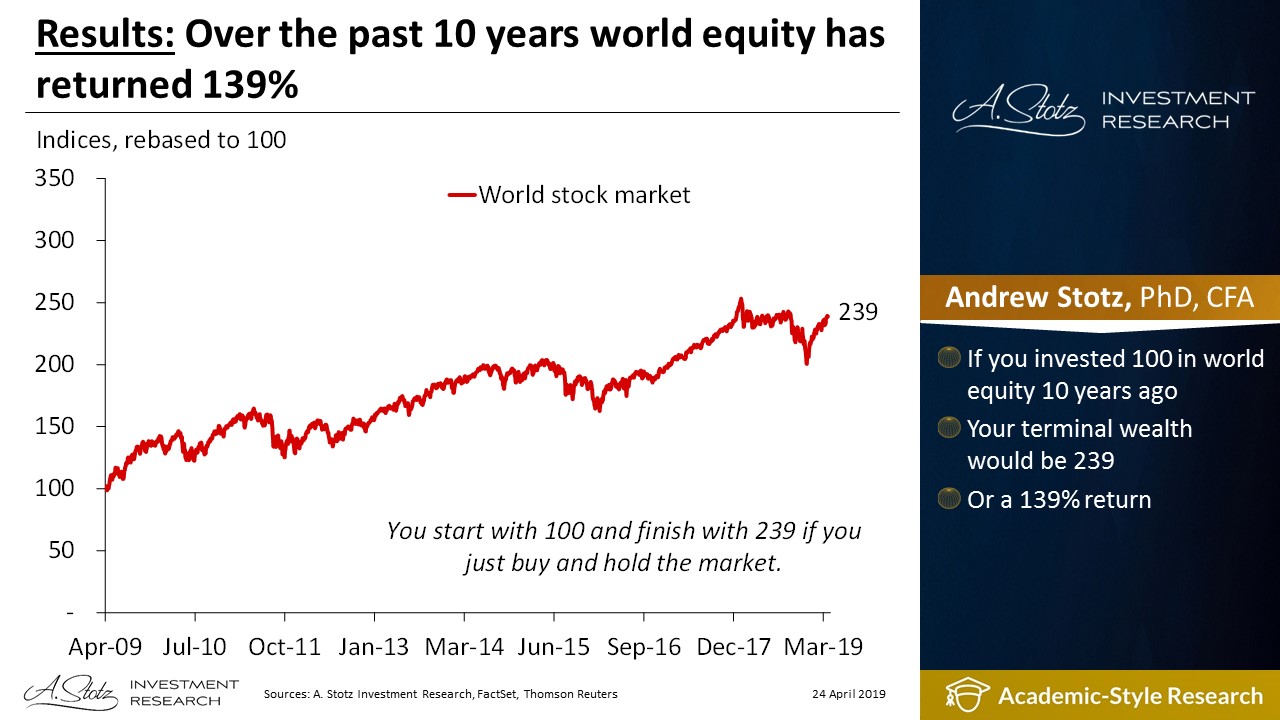
If you invested 100 in world equity 10 years ago, your terminal wealth would be 239 or a 139% return.
Missing the 10 WORST days increased your total gain by 44%
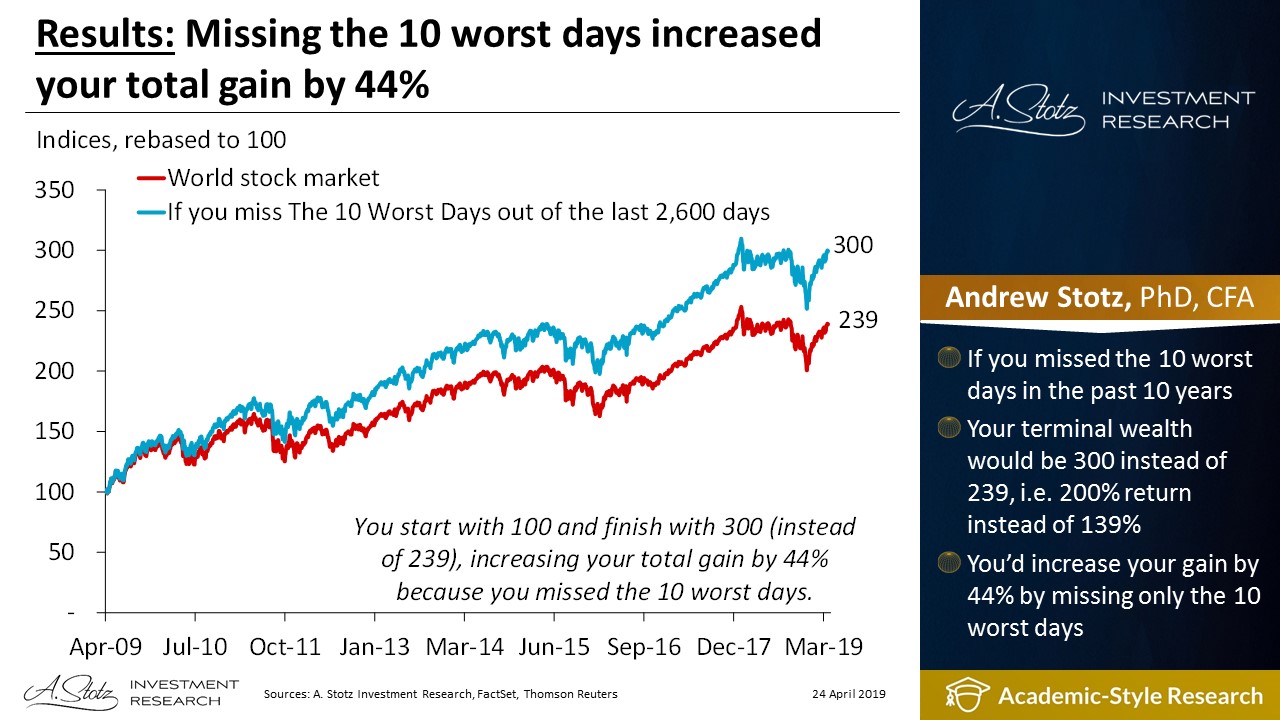
If you missed the 10 worst days in the past 10 years, your terminal wealth would be 300 instead of 239, i.e. 200% return instead of 139%. You’d increase your gain by 44% by missing only the 10 worst days.
100 simulations showed an increase in the total gain of between 35% and 53%
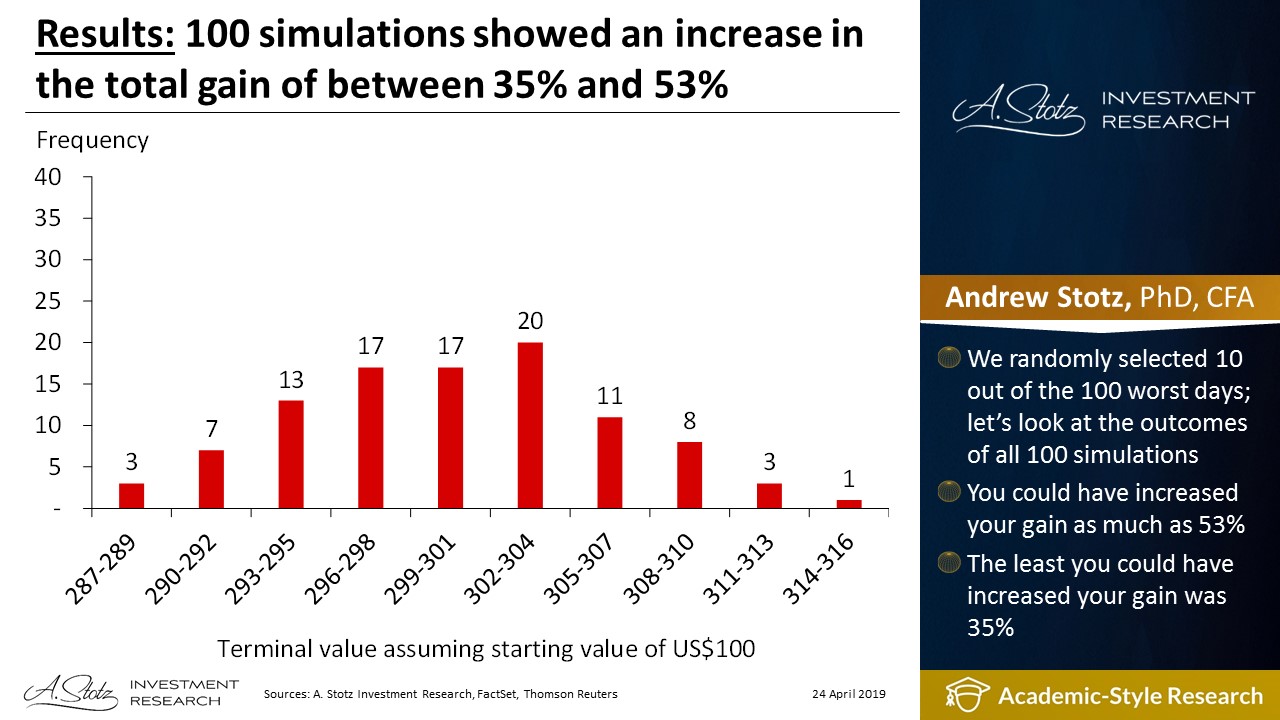
We randomly selected 10 out of the 100 worst days; let’s look at the outcomes of all 100 simulations. You could have increased your gain as much as 53%. The least you could have increased your gain was 35%.
Missing the 10 best days eliminated 31% of the total gain
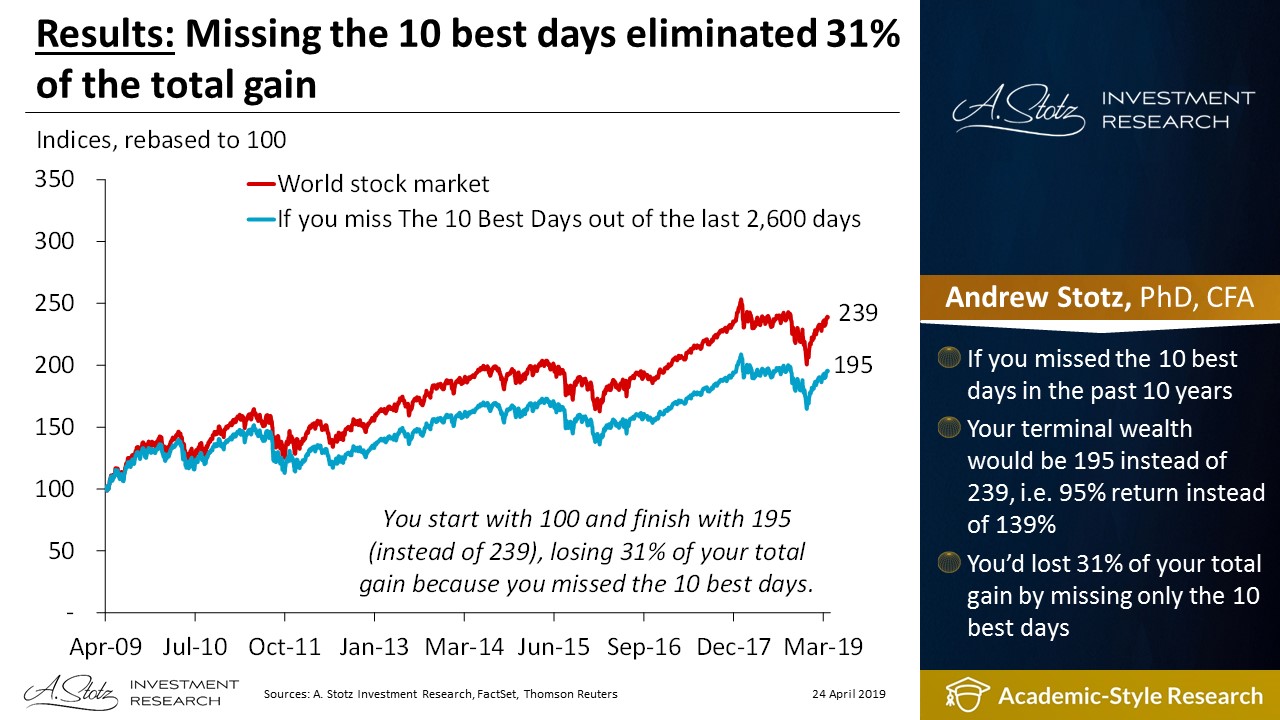
If you missed the 10 best days in the past 10 years, your terminal wealth would be 195 instead of 239, i.e. 95% return instead of 139%. You’d lost 31% of your total gain by missing only the 10 best days.
100 simulations showed a lost gain of between 27% and 40%

We randomly selected 10 out of the 100 best days; let’s look at the outcomes of all 100 simulations. You could have lost as much as 40% of the gain. The least you could have lost was 27% of the gain.
Let’s compare missing the 10 best and 10 worst days in the past 10 years
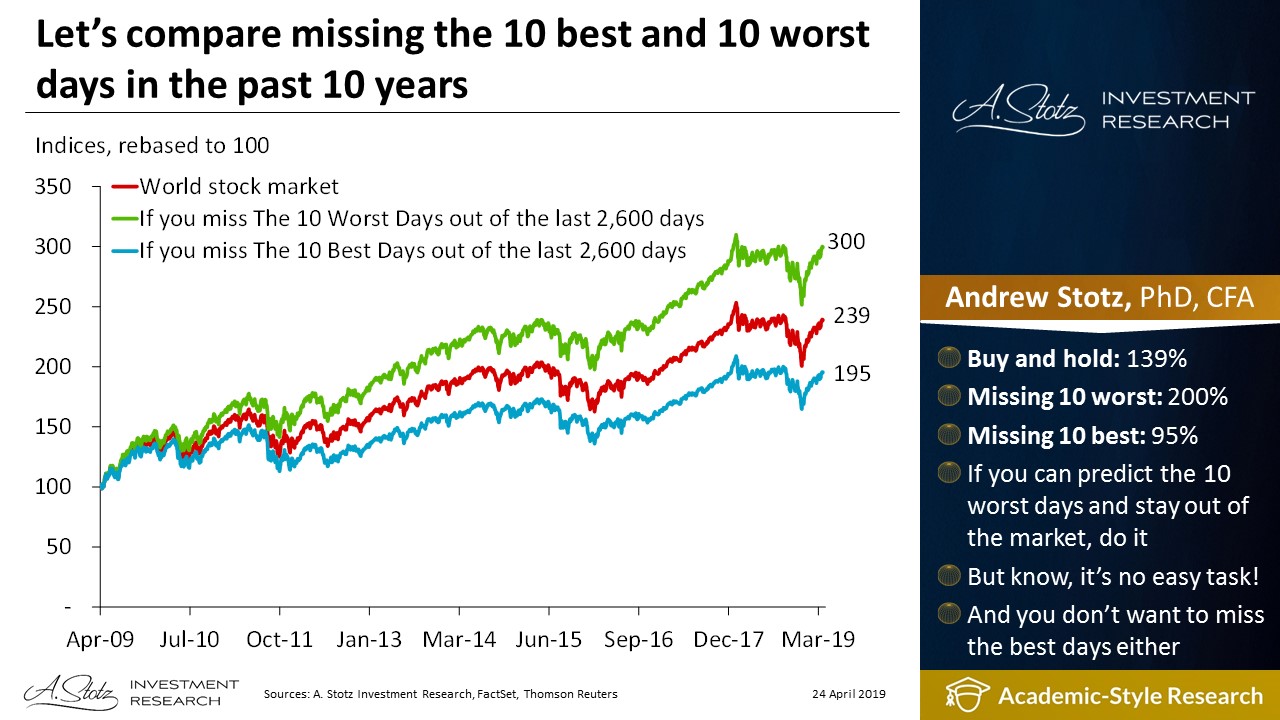
- Buy and hold: 139%
- Missing 10 WORST: 200%
- Missing 10 BEST: 95%
If you can predict the 10 worst days and stay out of the market, do it. But know, it’s no easy task! And you don’t want to miss the best days either.
The best days tend to cluster around the worst days
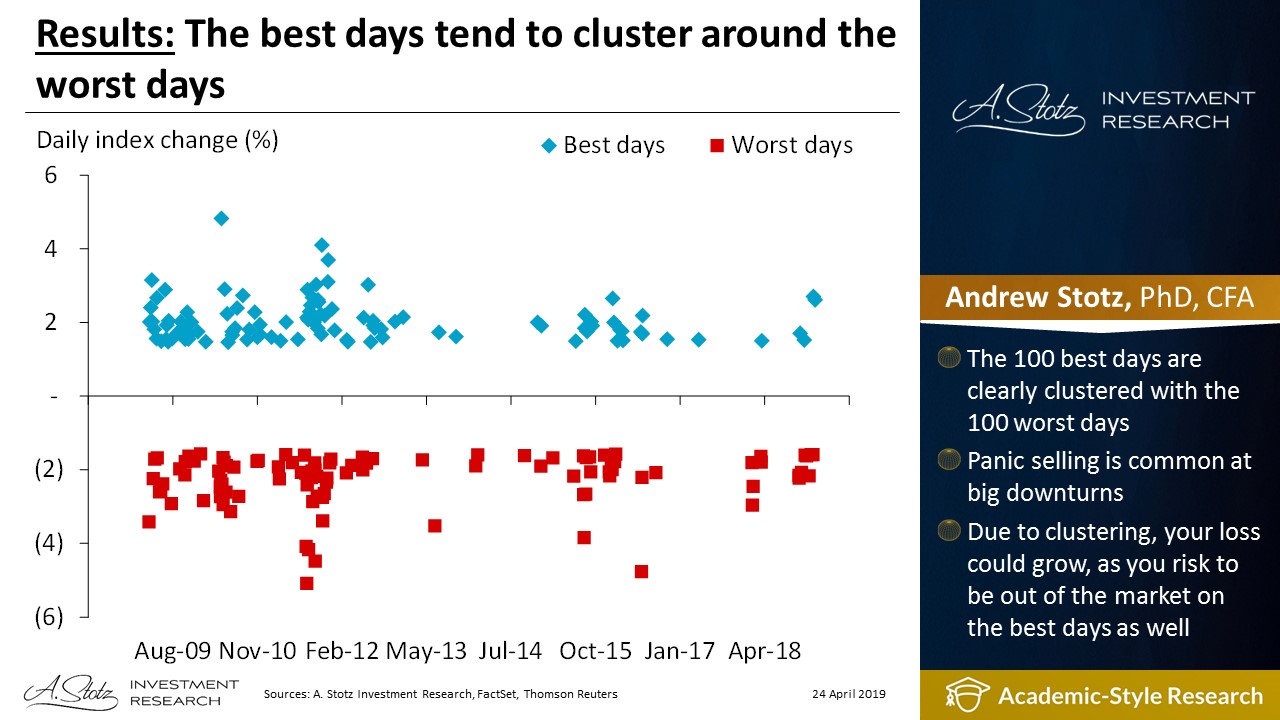
The 100 best days are clearly clustered with the 100 worst days. Panic selling is common at big downturns. Due to clustering, your loss could grow, as you risk to be out of the market on the best days as well.
Action
Missing only the 10 WORST days during 10 years increases your terminal wealth significantly. On average, your gain increased by 44% compared to buy and hold. If you can perfectly time the market and be out of it on the 10 worst days you will become significantly richer. Unfortunately, that is a darn hard thing to do!
Missing only the 10 BEST days during 10 years seriously hurts your terminal wealth. On average, you miss 31% of the gain but can miss as much as 40%. Stay invested, so you don’t miss the 10 best days!
The best days tend to cluster around the worst days. Panic selling on the worst days can, therefore, result in missing the best days as well. Unless you’re a market-timing wizard, you’ll do best to buy and hold.
DISCLAIMER: This content is for information purposes only. It is not intended to be investment advice. Readers should not consider statements made by the author(s) as formal recommendations and should consult their financial advisor before making any investment decisions. While the information provided is believed to be accurate, it may include errors or inaccuracies. The author(s) cannot be held liable for any actions taken as a result of reading this article.