Beta Can Make the Difference Between “Buy” and “Sell”
Previously we have presented a study showing that high beta doesn’t translate into high returns, in contrast to what theory suggests. There are more challenges that an investor faces with beta, especially when it comes to valuation. In this post, we’re going to take a look at one of the simpler discounted cash flow models—the Dividend Discount Model—and how beta can impact the outcome of your valuation of a company.
The Dividend Discount Model
The Dividend Discount Model (DDM) values a stock by summing up the present value of all future dividends you estimate the company will pay:

The first future dividend payment in the formula above will be the current dividend (D0) multiplied with some growth rate (g) and discounted back to present value by using a discount rate (r).
The rationale behind discounting is that $1, three years from now, is worth less than $1 in your hand today. This is because there is always a risk that you don’t get that $1 that someone promised to give you three years from now. The higher the discount rate (r), the lower present value of a dividend payment (D).
We’ll keep it simple and not use the multi-stage DDM; as the DDM assumes an infinite series of dividends and the formula can be simplified and translated into words (if you want to see all the steps to get here, check out Wikipedia):

The current dividend payment (D0) is multiplied by a single constant long-term growth rate (g) and then divided by the cost of equity (which is the discount rate (r) used in the DDM) minus the long-term growth rate (g). One thing to note is that the cost of equity (r) must be larger than the long-term growth rate (g).
The long-term growth rate (g) is generally set to 1-5% as it is the growth rate to infinity; and in the long run a company can’t grow faster than the long-term GDP growth rate (as that would lead to the company in the end becoming the whole economy—impossible).
The cost of equity
You can think of the cost of equity as the return you, the investor, require to receive for investing in a certain stock. The cost of debt is straightforward because we know the interest paid on debt. However, the cost of equity needs to be estimated in some way. The estimated cost of equity usually differs among investors as they use different methods or inputs. The Capital Asset Pricing Model (CAPM) is one of the most widely-used models to estimate the cost of equity.
The CAPM formula to estimate the cost of equity:

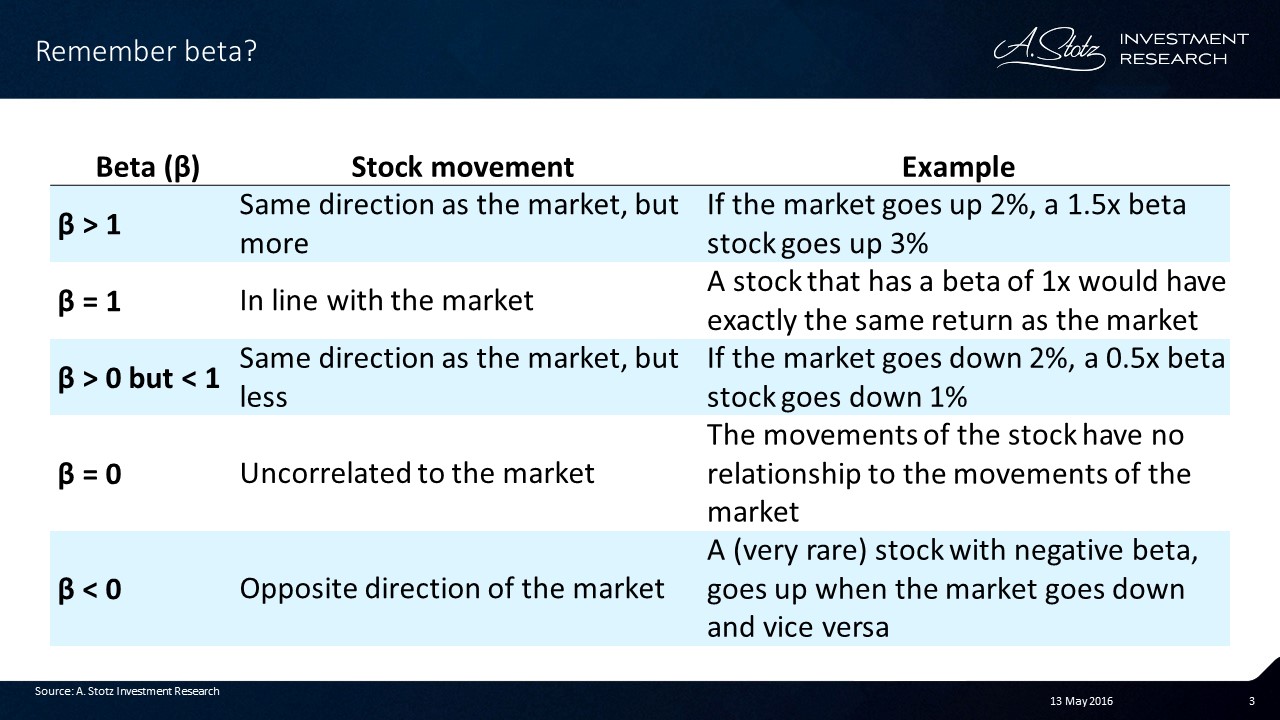
In other words, the expected return or cost of equity of a stock is the risk-free rate plus an additional risk premium. To get the risk premium, the market premium is multiplied by beta (β); a measure of risk that measures how sensitive the stock’s return is to market movements (mathematically the beta is the slope of a simple linear regression). The market premium is the market return minus the risk-free rate, i.e. the additional return you expect to get from investing in the riskier stock market instead of “risk-free” government bonds.
There are a few parameters in the CAPM formula that the investor needs to estimate or decide; the risk-free rate and the market premium. We’ll leave the risk-free rate and the market premium for another post, and focus on how to determine the beta in the cost-of-equity calculation.
DDM valuations are sensitive to the cost of equity which is sensitive to beta
Why spend a whole post on discussing beta’s impact on the cost of equity? The reason is that a DDM valuation is very sensitive to the cost of equity. Small changes in the cost of equity can lead to huge changes in the estimated value of a stock. The cost of equity estimated by CAPM is in turn very sensitive to beta, as the beta is multiplied by the market premium.
The table below is an example of how much impact the beta can have on your value estimate. This is the output from our valuation model on a company, with everything kept constant except beta. (In case you’re wondering, the other inputs in the DDM are: long-term growth rate (g) = 3%, risk-free rate = 3.5%, and market premium = 6.5%.)
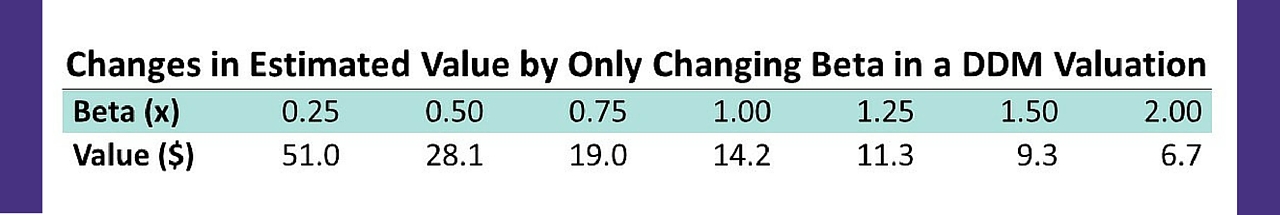
Assuming the stock is currently trading at $14, is the stock over- or undervalued? Well, to answer that, assuming your forecast is correct so far you’ll need to determine what beta to use.
The problem with estimating beta
There are two things you would need to know about estimating beta. First of all, you need to know over what time period to estimate beta; 6 months, 1 year, 2 years, 5 years? Secondly, you’d also need to decide what data frequency to use; daily? weekly?
This is something you need to know and make a decision about when estimating the beta, as your beta can differ a lot depending on those choices. Below is an example of an actual stock showing the different beta estimates for different time horizons and different data frequency.
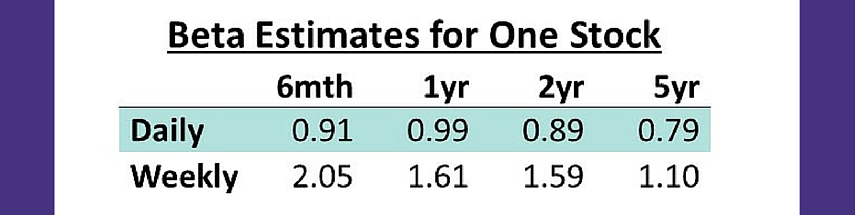
The results show that the beta was anything between 0.79x-2.05x for this specific stock. As shown in the previous section the beta can have a huge impact on your estimated value of the stock. So, how do you decide what beta to use?
What beta to use
At A. Stotz Investment Research we recently tested what happens to beta over time among an average of 10,000 stocks around the world. Beta was estimated based on weekly returns, as daily returns tend to include too much noise over longer time horizons. We ranked the stocks from highest to lowest beta and then looked at what happened to the average beta over 10 years for the 30% of the stocks that had the highest beta and the 30% of the stocks that had the lowest beta.

These findings imply that when you value a stock with a historically low beta, a good beta estimate would be about 0.7x and for a high beta stock about 1.1x. When a stock historically has had a neutral beta of 1x or you are forced to make a guess about beta without any information, your safest choice would be to set beta to 1x.
To go back to if the stock in the example above is over- or undervalued at $14, we take a look at its historical beta. We know it’s 1.8x, equating to a likely long-term beta is about 1.1x. Putting in a beta of 1.1x, keeping everything else equal, the DDM value of the stock is $12.9 and it’s overvalued by 8.5%.
As you can see from the examples we’ve shown in this post, beta can make the difference between a stock being a “buy” or a “sell” and it’s, therefore, important to understand how it works and to come up with a way to handle the problems you’ll face as an investor.
DISCLAIMER: This content is for information purposes only. It is not intended to be investment advice. Readers should not consider statements made by the author(s) as formal recommendations and should consult their financial advisor before making any investment decisions. While the information provided is believed to be accurate, it may include errors or inaccuracies. The author(s) cannot be held liable for any actions taken as a result of reading this article.